


When evaluating college applications, admission officers try to ascertain whether applicants took advantage of opportunities in high school by taking available advanced placement and honors courses. The purpose of the inquiry is to determine if prospective students took the risk of challenging themselves with harder courses or did they play it safe and take the standard courses. While the former rewards students with more intellectual rigor and potential knowledge, the courses are generally harder and can put a student’s grade point average at risk. The latter provides a safer course of study and an easier path to good grades, but will offer less academic upside. Many college admissions officers believe that students that take the harder path will be more academically successful in college.
While the analogy is less than perfect, the situation does have similarities to the plight faced by many active investment managers. Investment managers are judged by how they perform against an industry benchmark. In so doing, they face a decision on how far from the benchmark they should stray when managing a portfolio. Should they play it relatively safe and manage their portfolio similarly to the benchmark or should they take risks and positions outside of the benchmark? The former will ensure that the manager’s performance is within a reasonable band of the benchmark, while the latter will provide both more upside and downside potential.
Understanding how a manager approaches this question is important to the manager selection process. When choosing an active manager, investors want to be sure that their manager is truly active and not a closet indexer, especially if said manager is charging active management fees. A common metric used in the investment industry to assess this question is Active Share.
Active Share is a measure of the percentage of stocks in a portfolio that differ from the index. Within a reasonable framework, a high Active Share indicates that a portfolio differs greatly from the index and that the manager is actively managing the portfolio (if Active Share is too high it might indicate an inappropriate benchmark). A low Active Share, on the other hand, indicates that a portfolio is very similar to the index and that the manager may be an “index hugger.”
As can be seen on Chart 1, Active Share is a useful statistic, but has limited power in terms of predicting future manager outperformance. However, while a high Active Share does not indicate that a portfolio will substantially outperform an index (in fact, all things being equal it could just as easily underperform), it is a requisite for outperformance. Therefore, a manager must take active risk to even have a chance of outperformance. This makes assessing the amount of active risk an important step in choosing active investment managers.
Chart 1
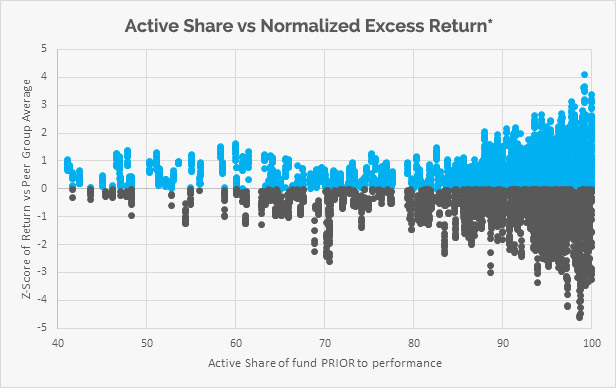
Source: FIS Group
In this context, Aapryl has incorporated a proprietary metric called Opportunity Score that goes deeper than Active Share in assessing a manager’s active risk. The Opportunity Score is a proprietary measure of active risk that is calculated using style turnover, number of holdings, the percentage of the portfolio in the top 10 holdings, and some proprietary performance measures as inputs. The Opportunity Score uses these inputs to rate managers on a 5 point scale (scores are normalized to be -.85,-.25, 0, .25, .85) to measure the relative amount of active risk taken by managers. A high Opportunity Score is an indication of high active risk, while a manager with a low score would indicate that a portfolio is very similar to the index.
Once calculated, the score can be used in a number of ways within Aapryl. First, users can screen managers for a minimum (or maximum if one is looking for passive investments) Opportunity Score. This is important because active risk is a requisite for excess return and it allows users to eliminate index huggers. Second, the Opportunity Score can be viewed across time so that users can view the consistency of the active risk taken by a manager and compare managers over time. Chart 2 provides an example of this display and contrasts a consistently active manager (Emerald) and a consistently passive manager (Vanguard). Finally, the Opportunity Score is incorporated into the Aapryl Return calculation which predicts the manager’s excess return for the next 3 years.
Chart 2
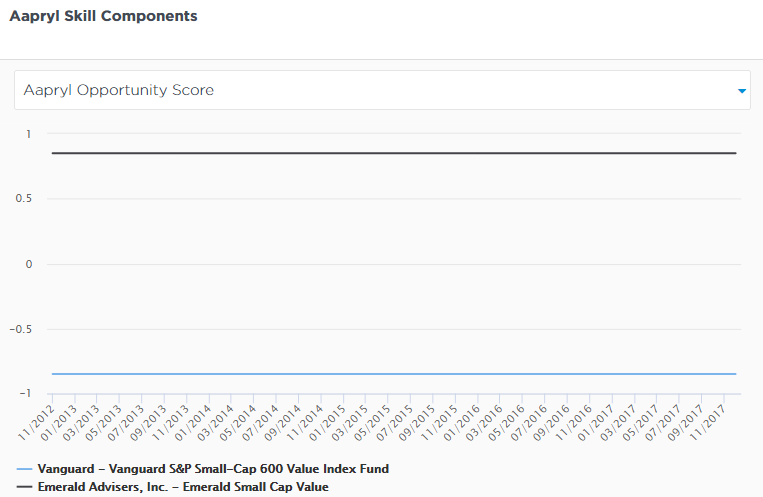
Source: Aapryl, Morningstar
While the Opportunity Score by itself is not a good predictor of future excess return, it is a useful metric that provides insight into the manner in which a manager is running a portfolio. Excess return can only be earned when a manager attempts to capitalize on market opportunities by taking active risk. A manager who plays it safe by hugging an index will not add value beyond the benchmark’s return. In fact, if that manager is charging active management fees, the most likely result will be a return below the benchmark (index return minus fees). Aapryl’s Opportunity Score was designed in this context. It is a lens into the possibility of a manager’s future success that shows whether a manager is taking the risks required to succeed. From a manager selection standpoint, this is critical information that investors need to be successful as well.
