Many of the top pension funds are using the Aapryl platform to gain insight into your products and skill. Aapryl’s manager skill prediction algorithms increase the likelihood of choosing tomorrow’s top performing managers, rather than yesterday’s. See what they see to with our customizable Aapryl Reports and be fully prepared when stepping into the boardroom.
Average Alpha, forward looking 36 months
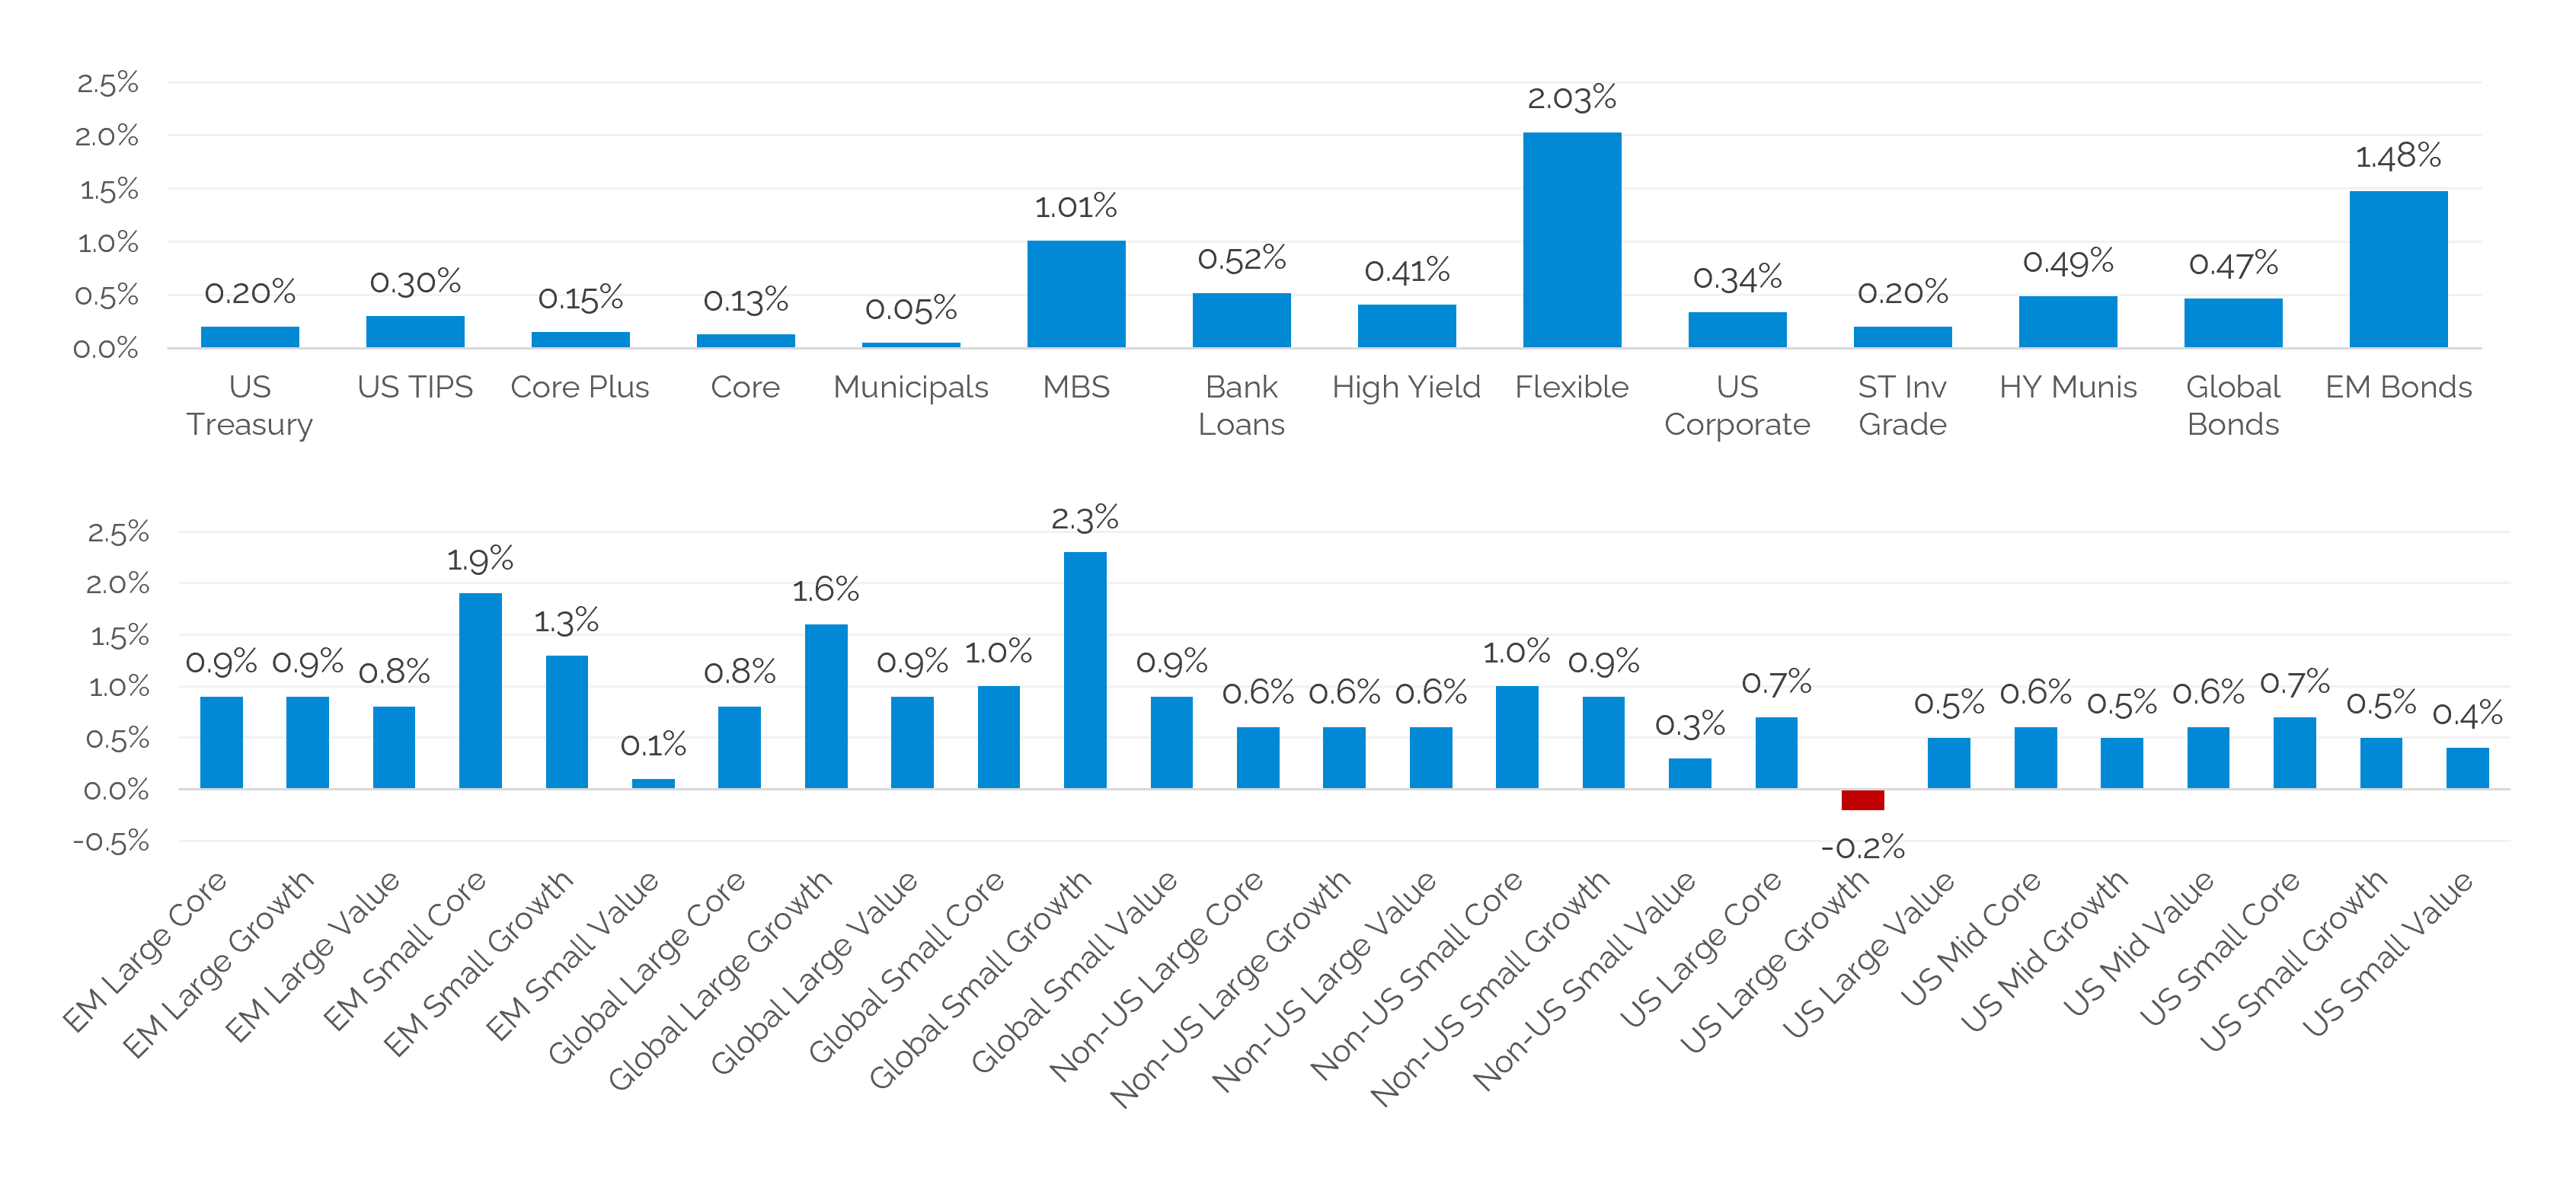
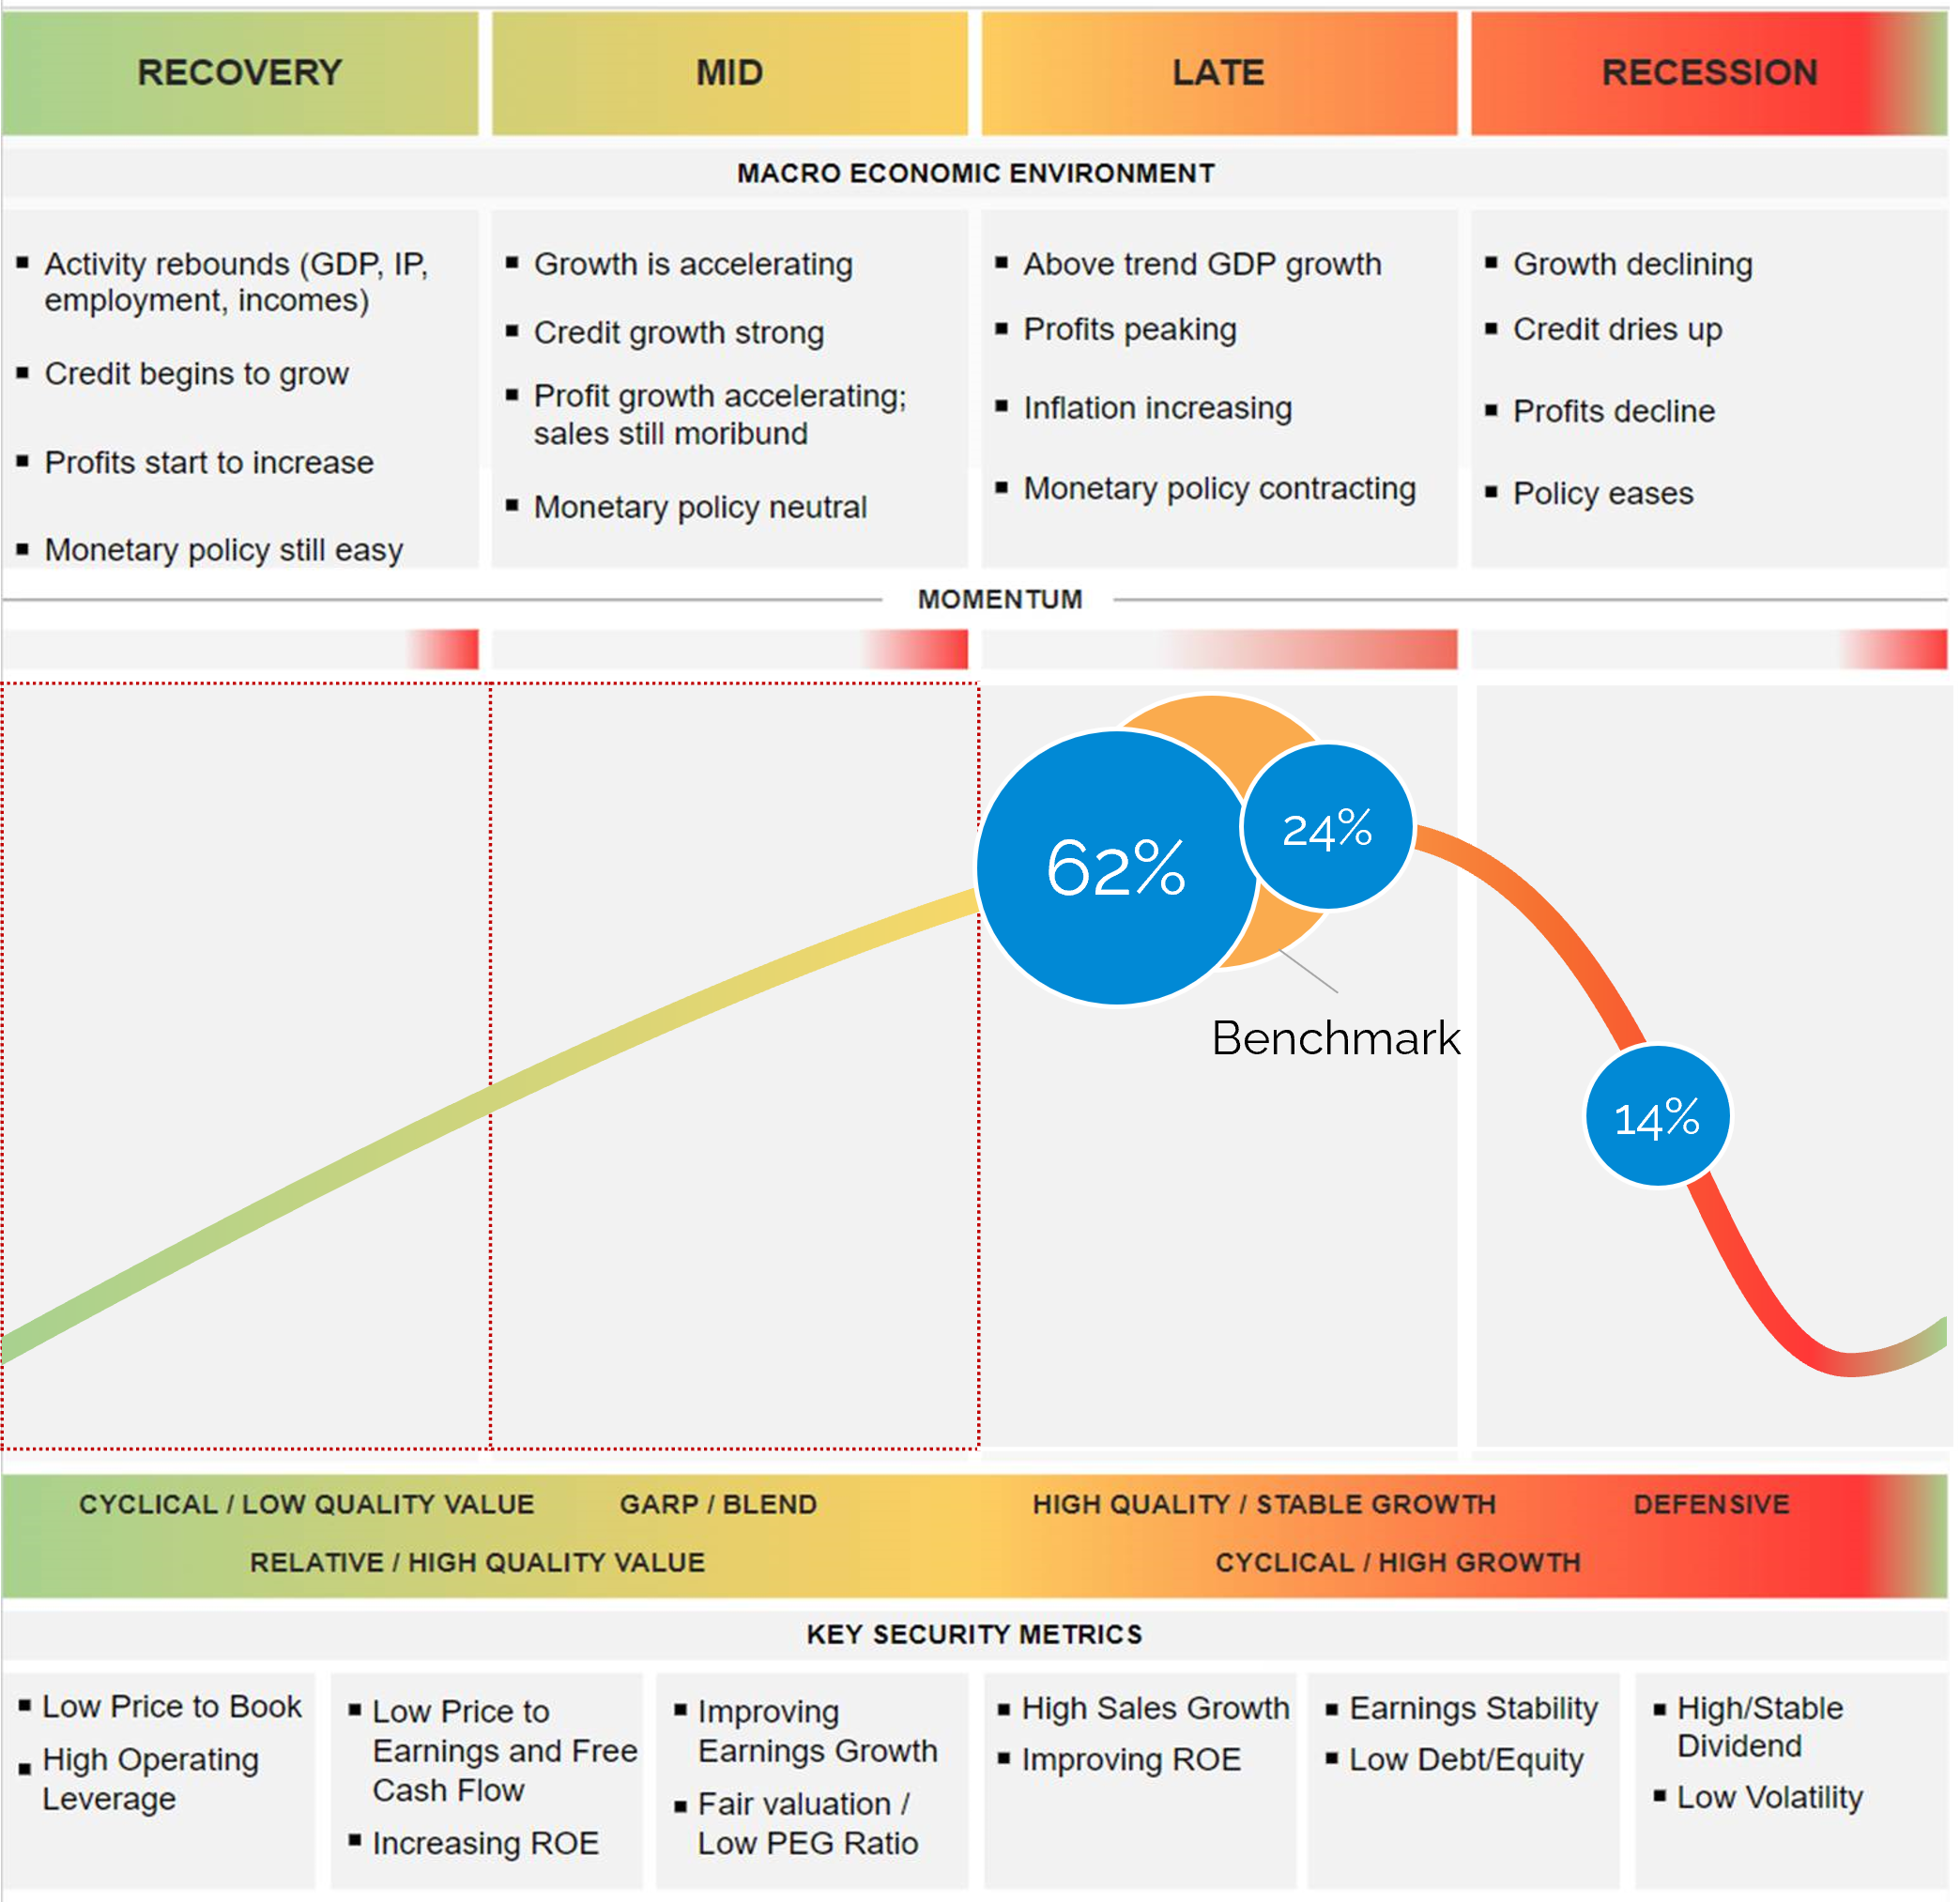
Aapryl Skill Scores replace standard market benchmarks with ”clone” portfolio benchmarks that capture significant and persistent style effects
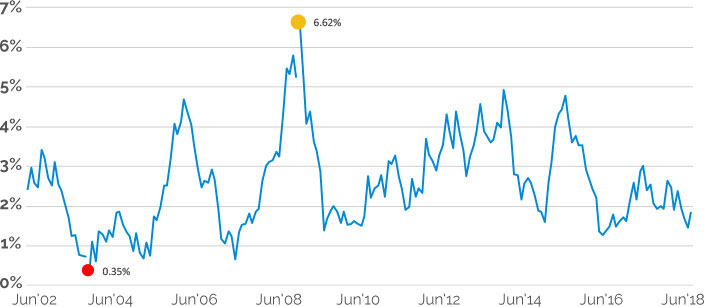
 Skill Metrics are further normalized for the length of the track record, with confidence and conviction growing with time.
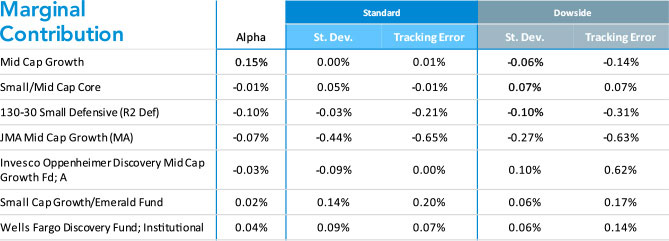
Performance benchmarks are frequently imprecise measurements of manager skill
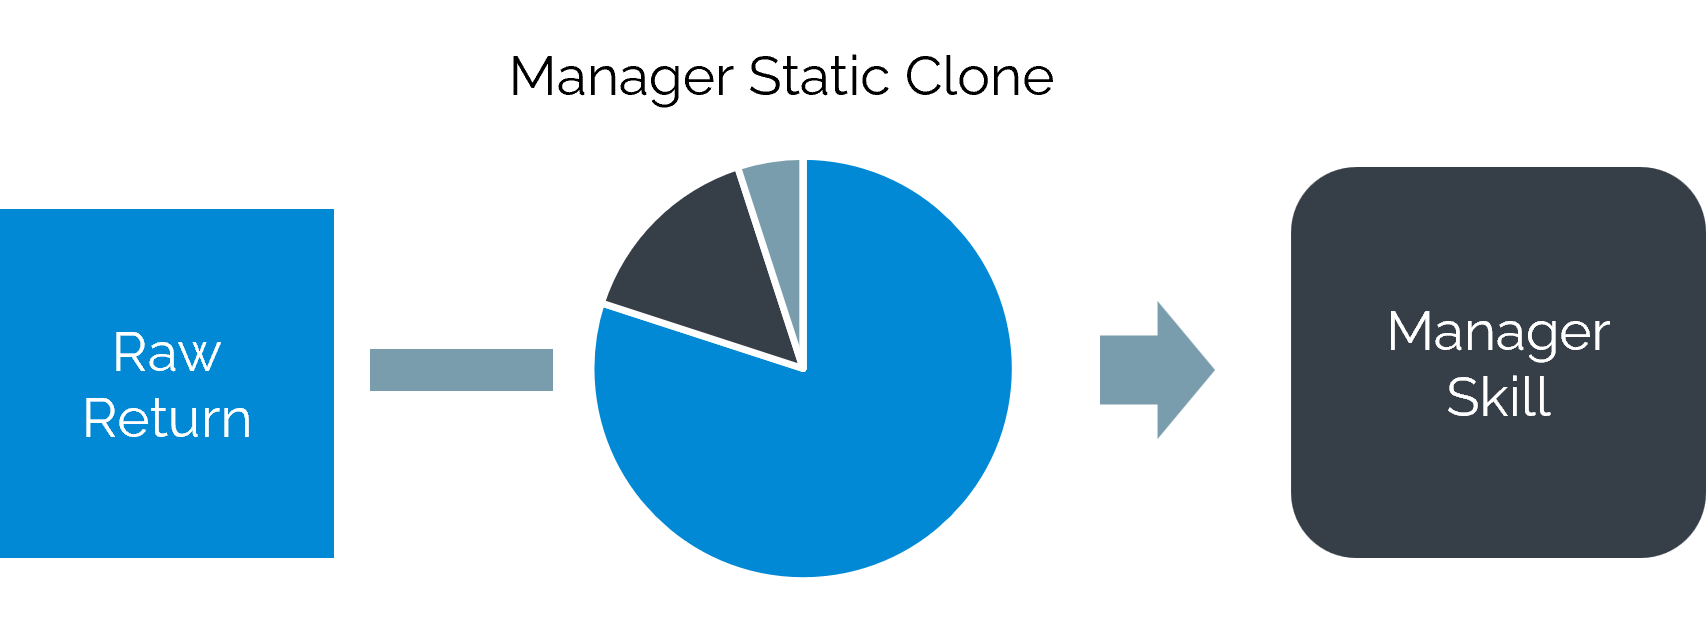
 Aapryl’s customized benchmarks, or portfolio replication “clones” render superior performance evaluation.
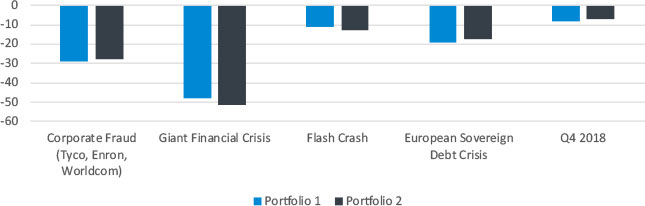
Aapryl Provides More Accurate and Stable Alpha Targets for Mean Variance Portfolio Optimization Along With Robust Risk Analysis
Frontier Chart 7 Manager Products; 1/1988 to 3/2019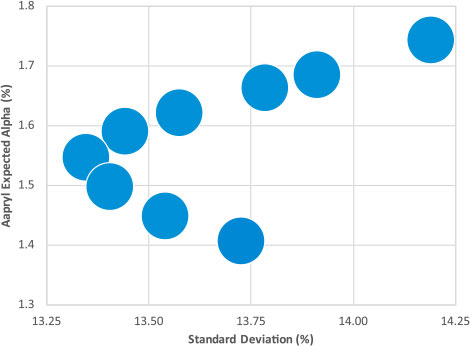 Aapryl’s Portfolio Analysis tool allows allocators to construct new portfolios and analyze existing ones. Construct your portfolio to maximize true alpha and skill as well as manage your risk.
 Skill Metrics are further normalized for the length of the track record, with confidence and conviction growing with time.
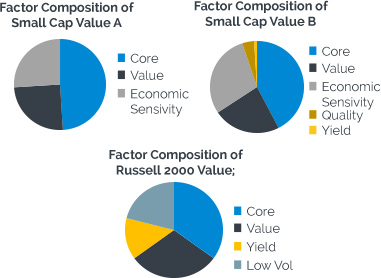
Factor Exposures vs. Peer Group Average
Manager A – Stable Value; Weights (%); As of 6/2020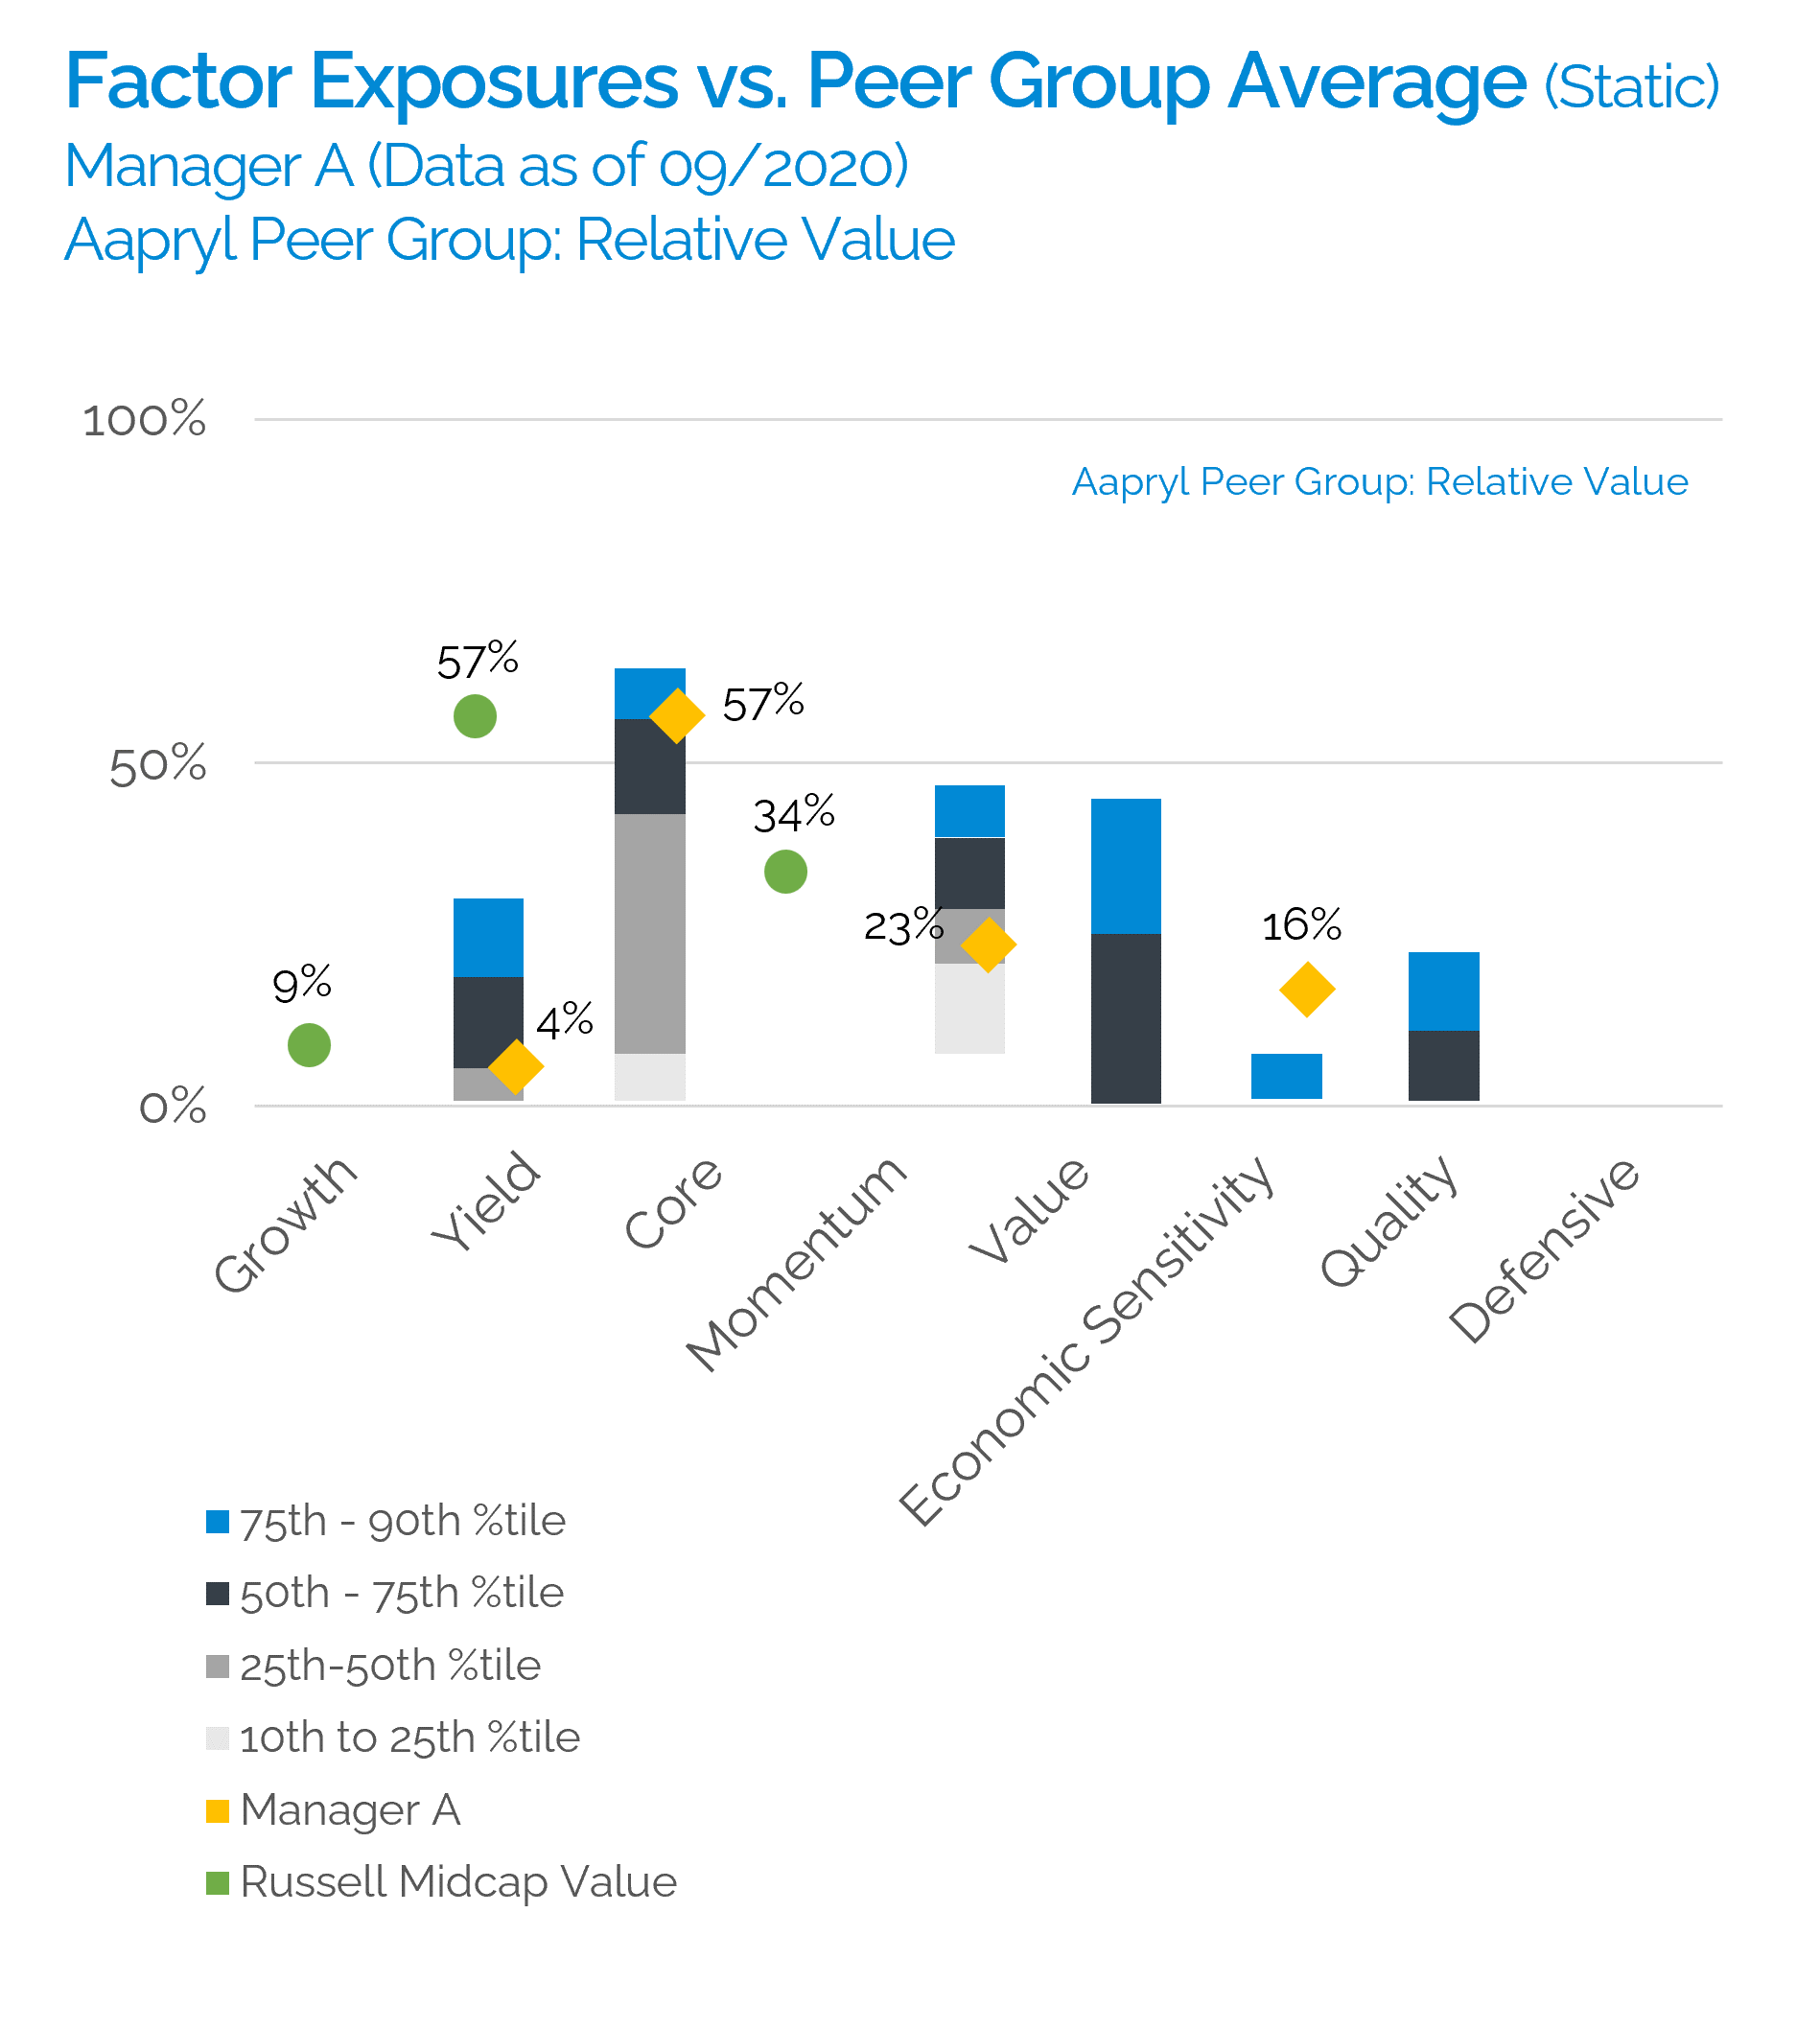 Aapryl’s customized benchmarks, or portfolio replication “clones”, render superior performance evaluation and objectively create peer groups for more relevant insights.