Ask Aapryl

Aapryl Reports for Managers


Aapryl Reports for Managers

Aapryl’s analytics solve lingering industry problems to give you unique insights into investment managers.

How Managers Can Take Advantage of Aapryl

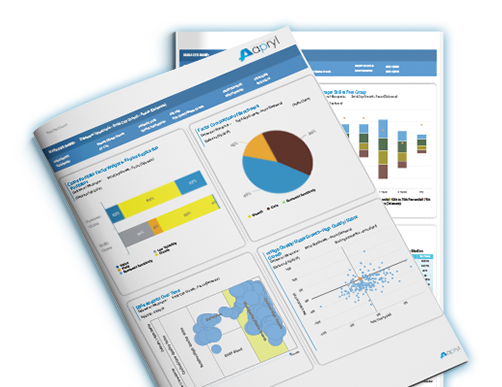
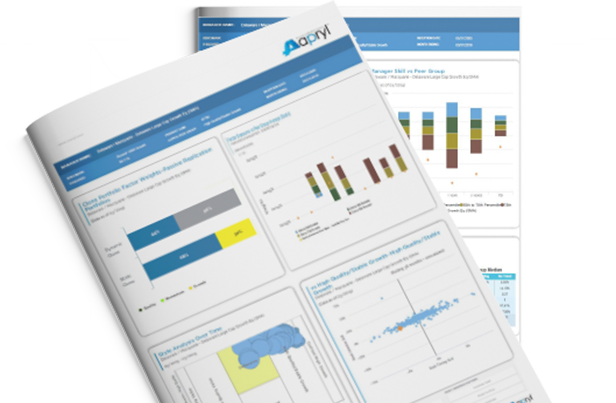
Our goal was to create a product that allows managers to not only understand their portfolio at a deeper level, but also be able to communicate their value to clients in a clear and concise manner. Aapryl provides investment managers the ability to present their information to current and prospective clients in a manner that clients can understand easily with in the context of their true peers:

Illustrate Your Investment Philosophy

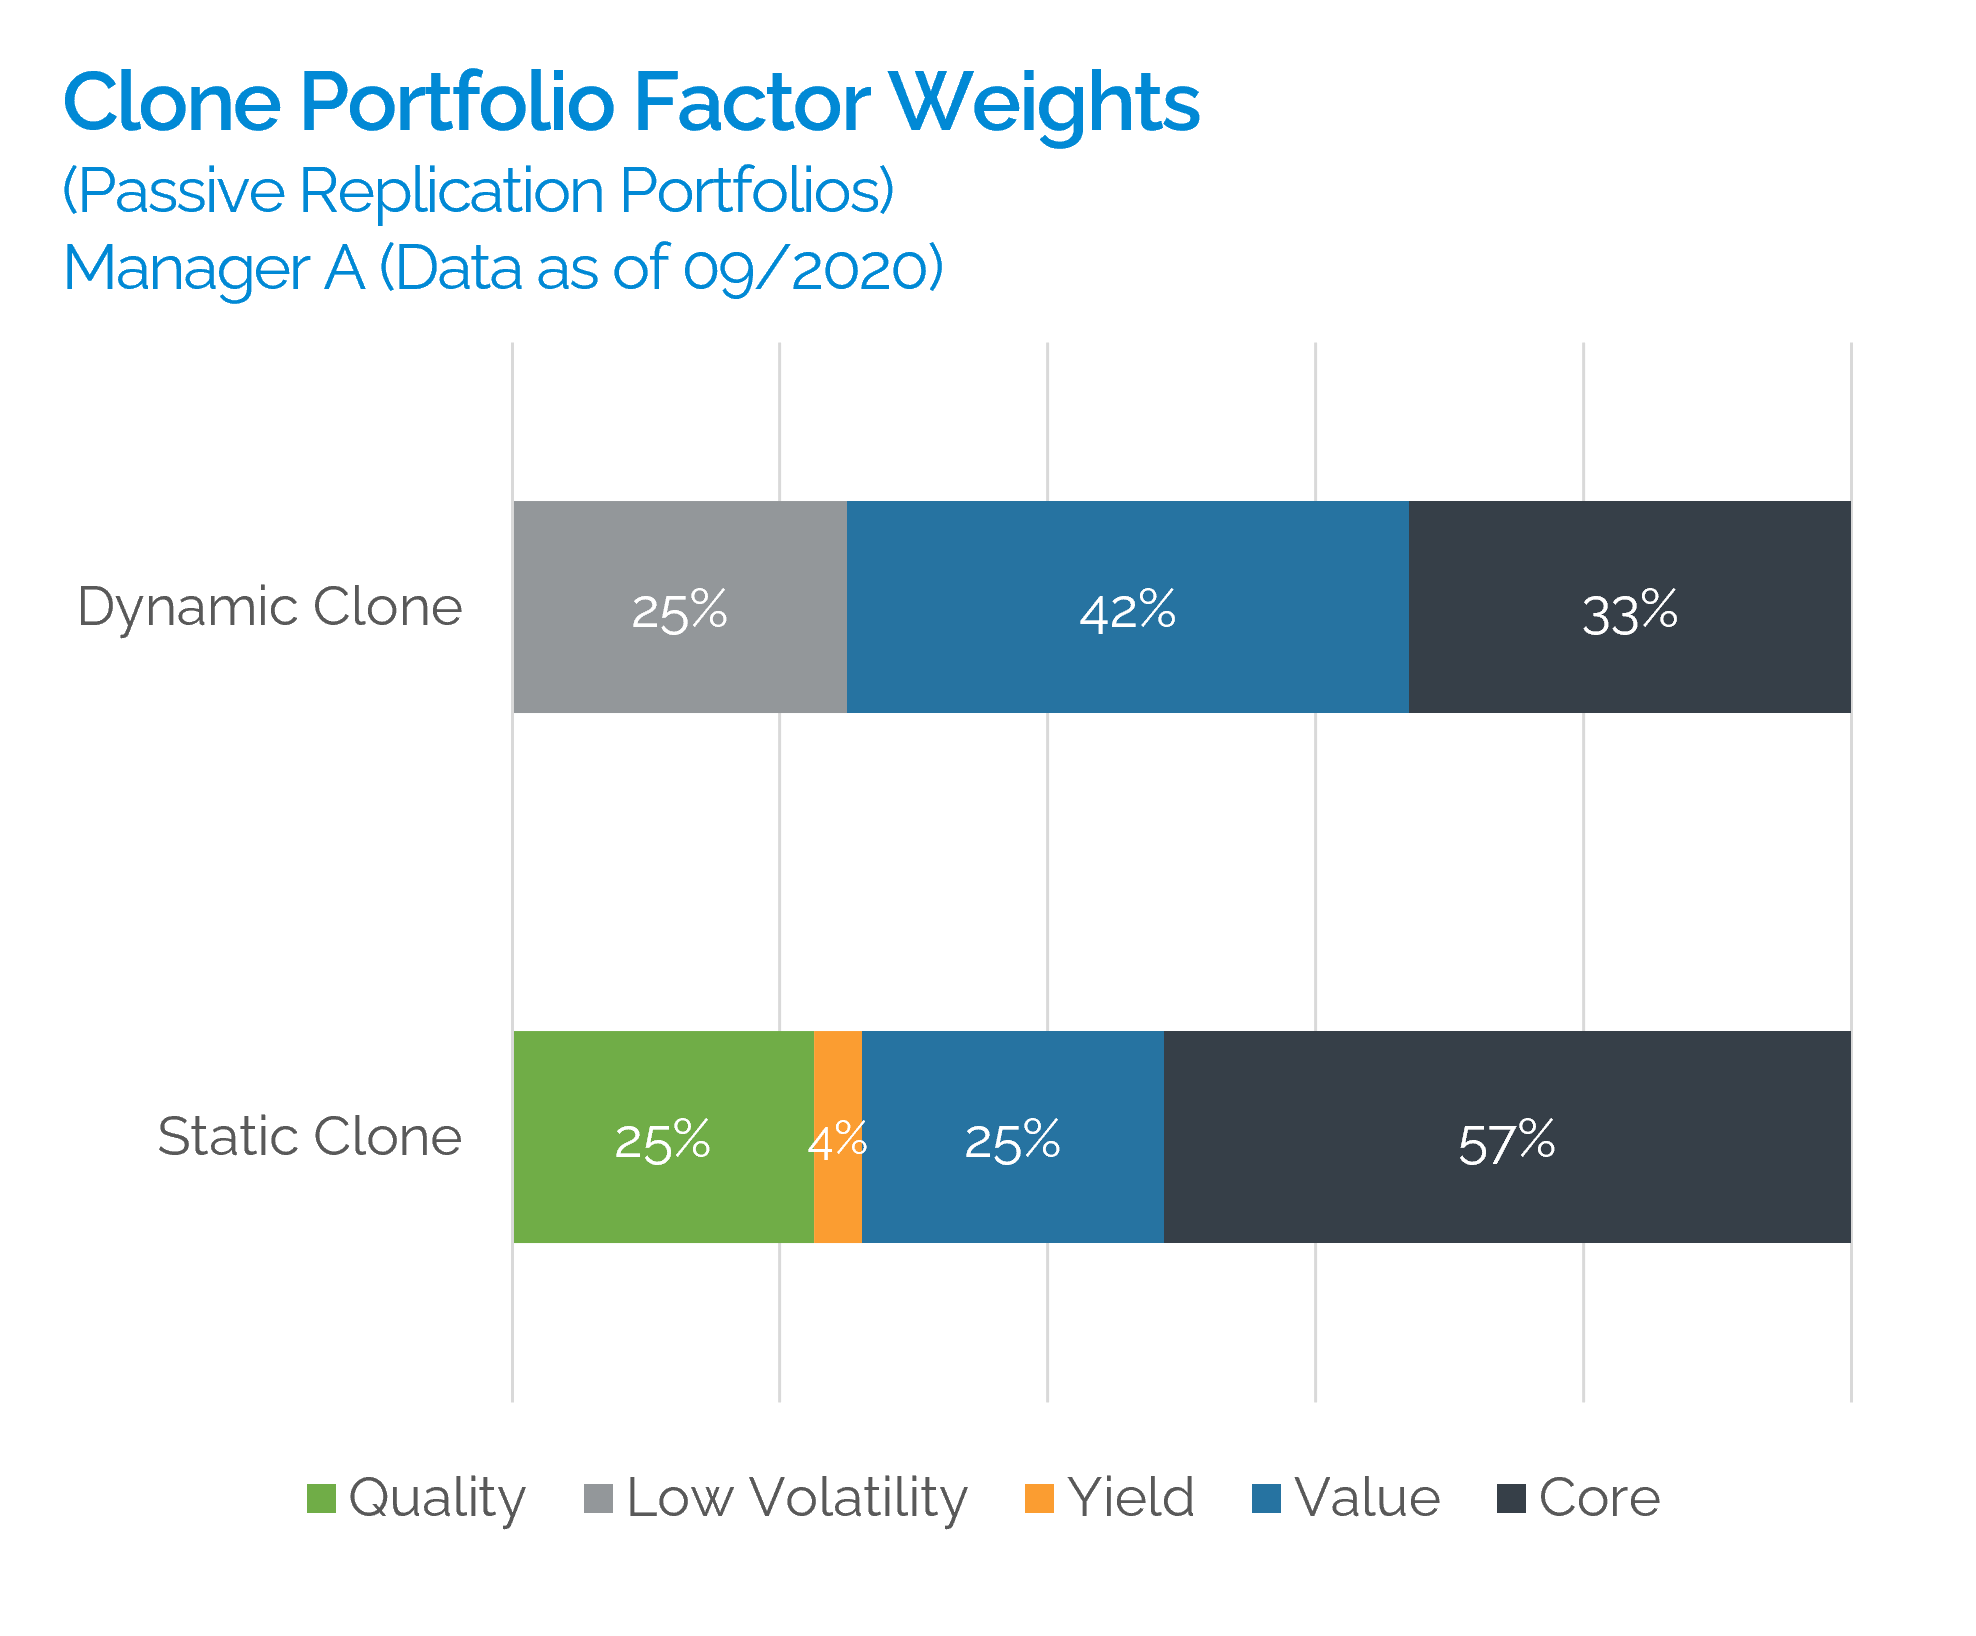
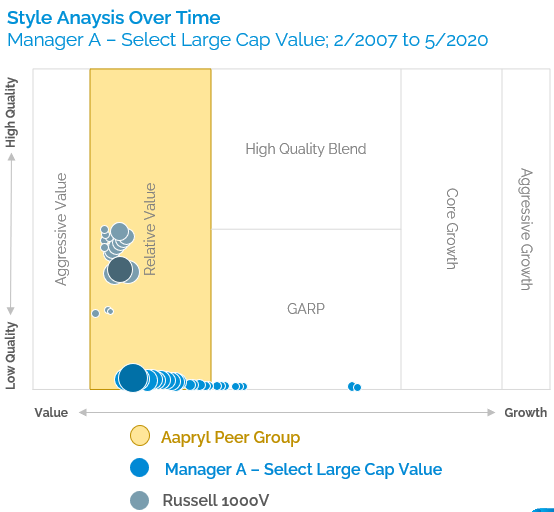
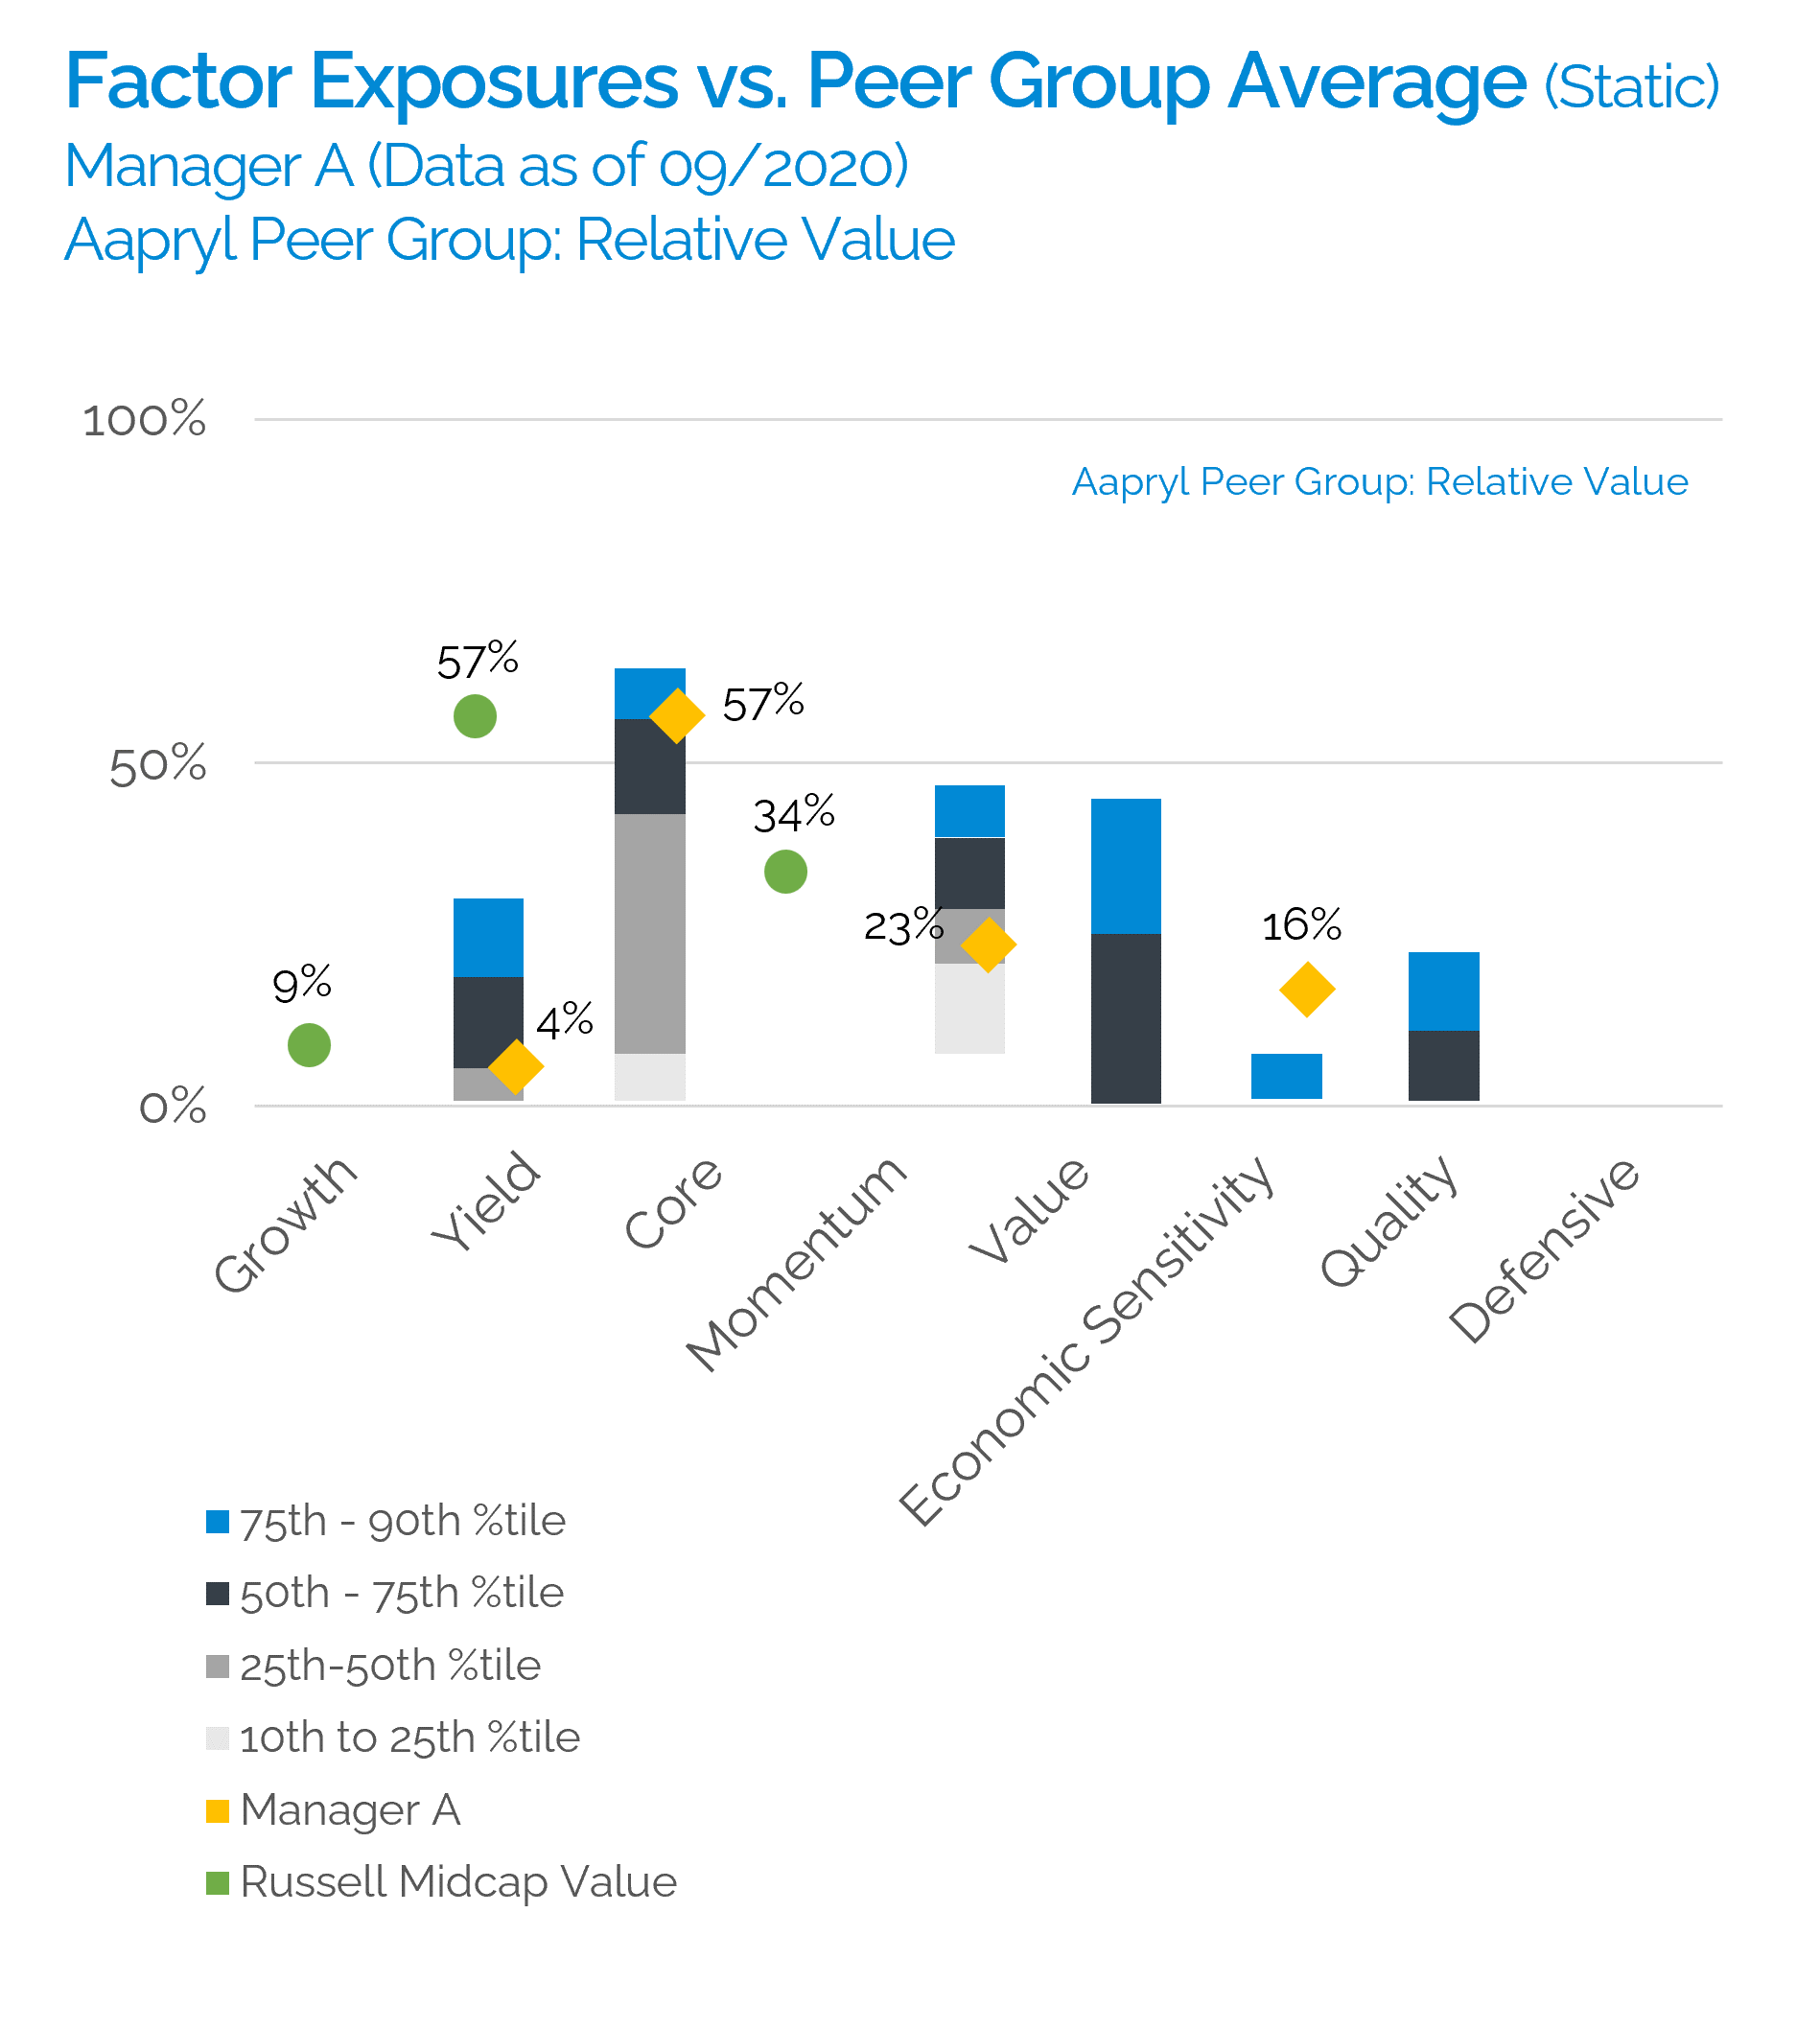
Benchmarks by which managers assess themselves are too broad, and thus fail to define the true style of a given asset manager. Aapryl’s portfolio replication methodology and proprietary factor mapping system allows managers to clearly show how they differ from the benchmark as well as their peers. We address this problem by building 2 clone portfolios using returns based analysis (RBSA), where a time series of portfolio returns are regressed against a number of factors to explain what’s driving performance. Instead of providing a metric of either success or failure, this tool allows a manager to disaggregate their portfolio to find out what has been driving returns, when are they successful, what areas can they improve in, and most importantly how their product fits within a client’s portfolio.

Contextualize Your Performance

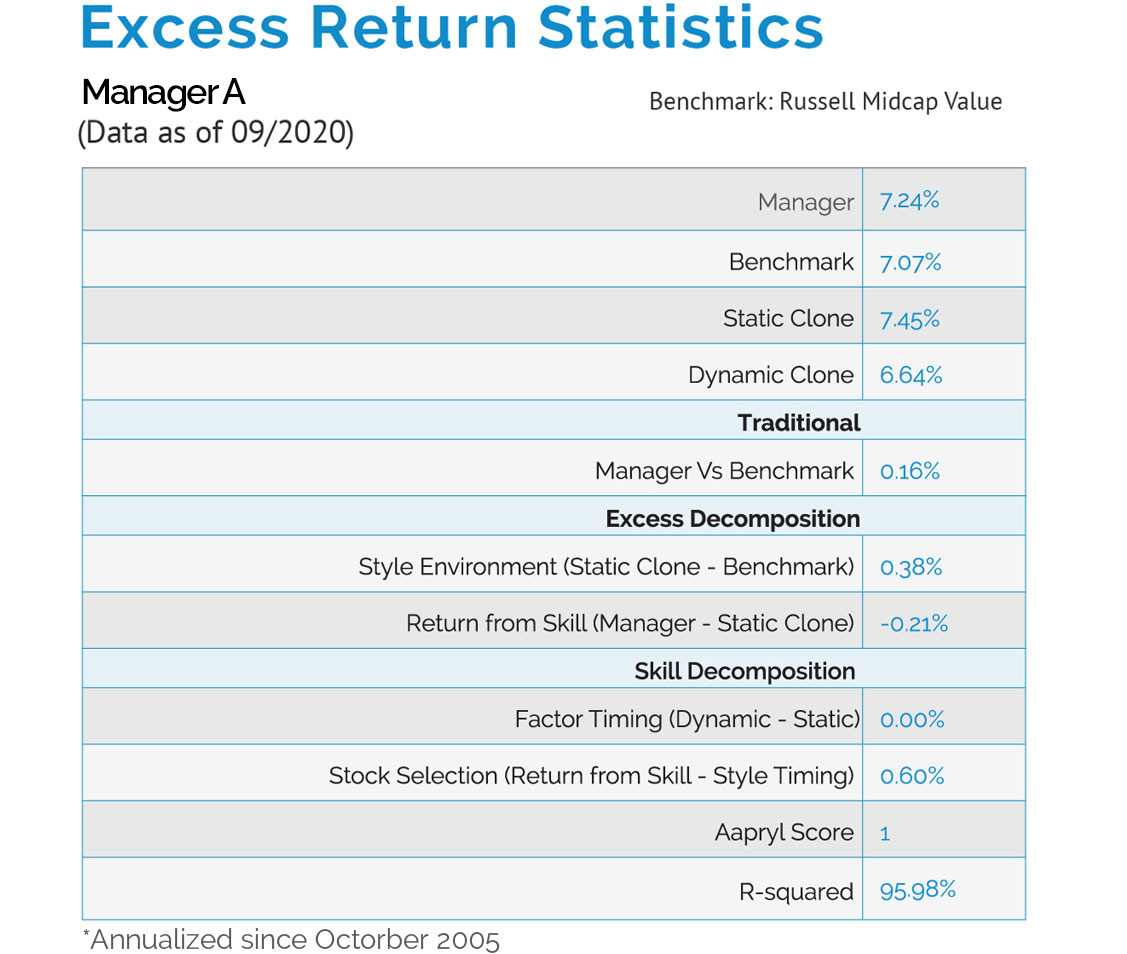
Aapryl provides managers with an intuitive framework for explaining the contributions to performance derived from their product’s style environment, stock selection and style timing. Once a manager’s style is identified, their “true excess return” or skill can be calculated and decomposed. Traditionally, Excess Return or alpha is calculated as the difference between the manager’s return and it’s stated benchmark. Aapryl breaks down the traditional alpha further by stripping the style return away from its traditional Alpha, focusing on returns directly attributed to the manager’s active decisions and hence its true Alpha.

Differentiate Yourself Amongst Peers

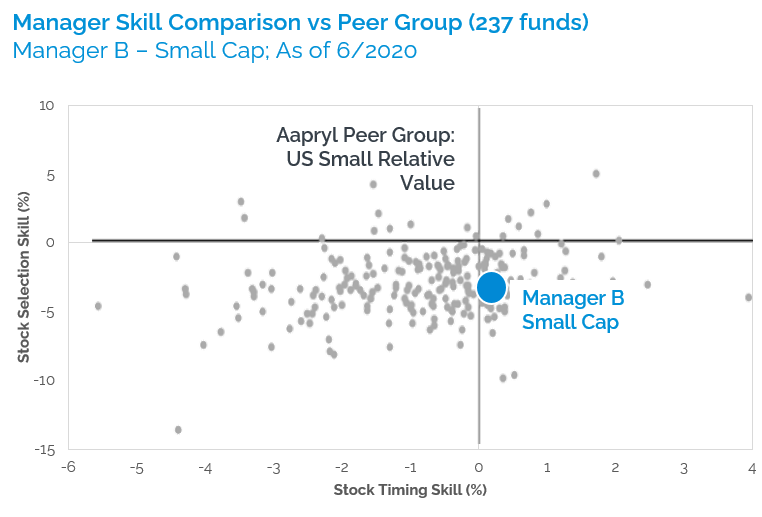
Aapryl does a better job at comparing investment managers to their more specific peer groups than other platforms. When comparing managers to other managers, utilizing benchmark as the sole filtering criteria is not sufficient; a manager’s true style can vary significantly from their stated benchmark. Peer rankings provide a general view of how a product has done versus their benchmark, but through style clustering, Aapryl can help investment managers understand how they have done versus other managers who have similar characteristics to them. Excess return and thus, manager skill, can be compared to more like peers.

Download a Sample Aapryl Report and detailed explanation

Download PDFPrint ReportShare Page
Receive a complimentary personalized Aapryl Report to understand what Investors and Consultant are already seeing. Armed with this detailed insight, communicate your value more effectively and win more business.

Fill the form below and receive your complimentary Aapryl Report on a specific manager product.

    * We value & respect your privacy and will never spam you with mass emails. Also, we will never share your email address with any third party.

    • Lipper: Copyright 2020 © Reuters. All rights reserved. Any copying, republication or redistribution of Information, including by caching, framing or similar means, is expressly prohibited without the prior written consent of Lipper. Lipper shall not be liable for any errors or delays in the content, or for any actions taken in reliance thereon.
    • MSCI: Copyright MSCI 2020. All Rights Reserved. Without prior written permission of MSCI, this information and any other MSCI intellectual property may only be used for your internal use, may not be reproduced or redisseminated in any form and may not be used to create any financial instruments or products or any indices. This information is provided on an “as is” basis, and the user of this information assumes the entire risk of any use made of this information. Neither MSCI nor any third party involved in or related to the computing or compiling of the data makes any express or implied warranties, representations or guarantees concerning the MSCI index-related data, and in no event will MSCI or any third party have any liability for any direct, indirect, special, punitive, consequential or any other damages (including lost profits) relating to any use of this information.
    • Russell: Frank Russell Company is the source and owner of the trademarks, service marks and copyrights related to the Russell Indexes. Russell® is a trademark of Frank Russell Company.
    • PSN: PSN Manager Data from Informa Investment Solutions, a division of Informa Business Intelligence, Inc. Informa and its affiliates are not responsible for any adverse consequences or trading, investment, or commercial decisions arising from use of or accuracy of the data.
    • Bloomberg: Bloomberg and its associated data, Copyright © 2020 Bloomberg Index Services Limited. Bloomberg® is a trademark and service mark of Bloomberg Finance L.P. and its affiliates (collectively “Bloomberg”). Barclays® is a trademark and service mark of Barclays Bank PLC (collectively with its affiliates, “Barclays”), used under license. Bloomberg or Bloomberg’s licensors, including Barclays, own all proprietary rights in the Bloomberg Barclays Indices. Neither Bloomberg nor Barclays approves or endorses this material, or guarantees the accuracy or completeness of any information herein, or makes any warranty, express or implied, as to the results to be obtained therefrom and, to the maximum extent allowed by law, neither shall have any liability or responsibility for injury or damages arising in connection therewith.