

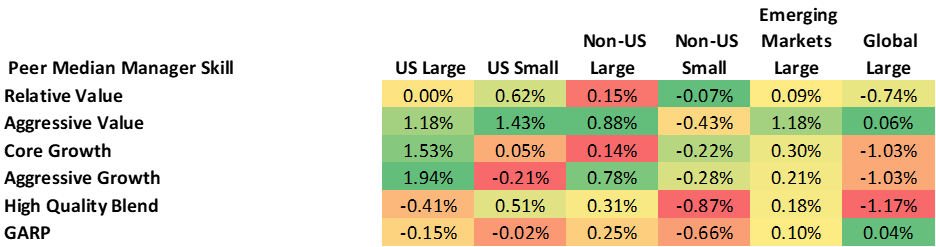
The Aapryl Quarterly Market Insight offers a lens on how active managers in general performed in various markets and sub-segments. Using Aapryl’s proprietary methodology, we measure manager skill by using the manager’s static clone (long term factor profile) as a measure of skill instead of the broad market benchmark. Manager skill is calculated by using the manager’s raw return less their static clone return.
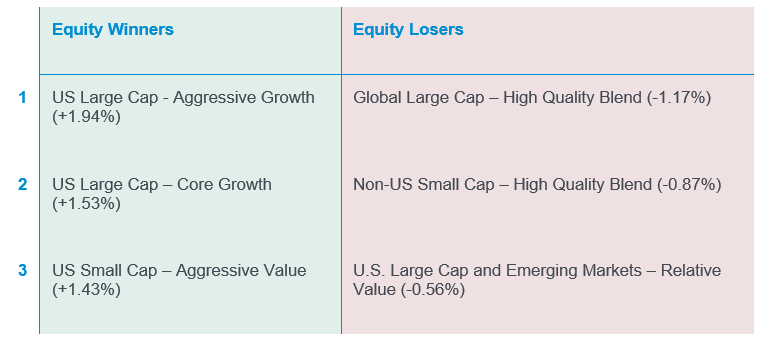
2Q 2023 continued the growth rally which was fueled by seven U.S. large cap stock benefiting from the increased market interest in companies leading the artificial intelligence development, while value is lead by U.S. Small Cap Aggressive Value. For the second quarter in a row, median managers within Aapryl’s peer groups US Large Cap Aggressive Growth lead the pack with +1.94% outperformance (relative to their respective static (style) clones), followed by US Large Cap Core Growth with +1.53%. Quality managers led the equity losers during the quarter with Global Large Cap High Quality Blend peer group median -1.17% followed by Non-US Small Cap High Quality Blend -0.87%.
Below are the top three winners and bottom three losers based on the performance of their respective peer group medians for the prior quarter:
Aapryl Peer Group Manager Skill Performance Matrix
Quarter Ending 6/30/2023
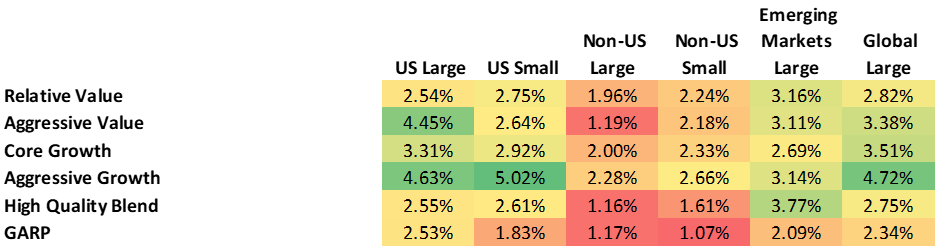
The performance spread between the top and the bottom quartile within their respective peer groups varied for each Aapryl peer group is shown below. The biggest performance spread between the peer groups top quartile vs bottom quartile occurred in the US Small Cap Aggressive Growth (+5.02%) growth peer group, with the lowest spread occurred in the Non-US Large Cap High Quality Blend (+1.16%) peer group for the quarter.
Top Quartile vs. Bottom Quartile
Quarter Ending 6/30/2023
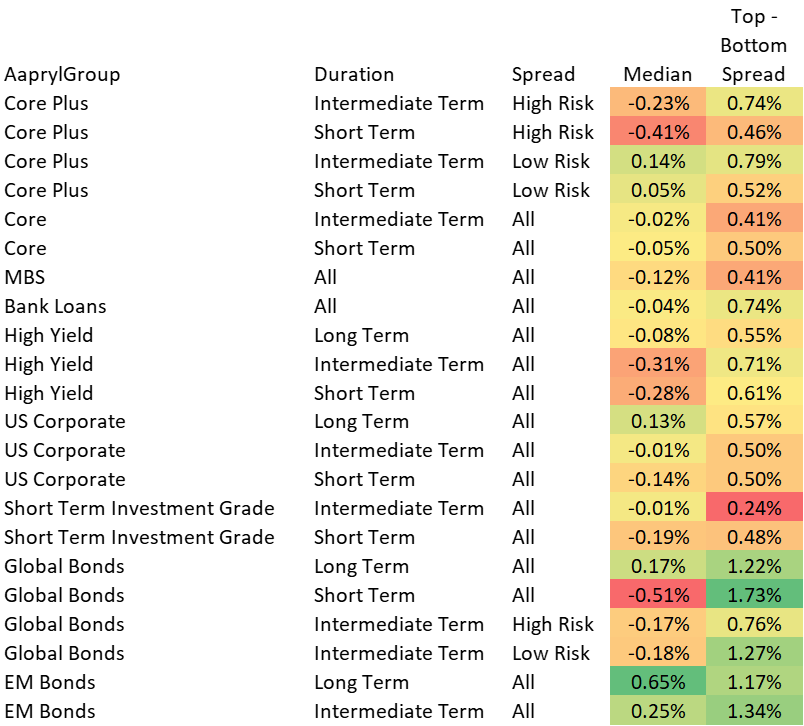
Fixed Income Manager Performance During the Quarter
Active managers in Fixed Income continue to show performance differences between top and bottom quartile managers. The highest spread occurred in Global Bond Short Term All Spread peer group median +1.73% while Short-Term Investment Grade Intermediate Term All Spread had the lowest spread of +0.24%.The EM Bonds Long Term All Spread median managers performed the best with +0.65%, while Global Bond s Short Term All Spread performed the worst with -0.51% median return.