


| # of Funds: | 1,097 |
| Excess Return Ranking (5 Years Ended 12/31/09): | Highest Quintile (1) |
Quintile ranking in subsequent non-overlapping 5-year period ended12/31/2014 (percentage of funds)
| Highest Quintile (%): | 13.5 |
| High (%): | 16.6 |
| Medium (%): | 20.3 |
| Low (%): | 16.2 |
| Lowest Quintile (%): | 23.5 |
| Merged/ Closed (%): | 9.9 |
| Total (%): | 100.0 |
| # of Funds: | 1,083 |
| Excess Return Ranking (5 Years Ended 12/31/09): | High (2) |
Quintile ranking in subsequent non-overlapping 5-year period ended12/31/2014 (percentage of funds)
| Highest Quintile (%): | 12.4 |
| High (%): | 13.5 |
| Medium (%): | 16.0 |
| Low (%): | 20.6 |
| Lowest Quintile (%): | 15.5 |
| Merged/ Closed (%): | 22.1 |
| Total (%): | 100.0 |
| # of Funds: | 1,084 |
| Excess Return Ranking (5 Years Ended 12/31/09): | Medium (3) |
Quintile ranking in subsequent non-overlapping 5-year period ended12/31/2014 (percentage of funds)
| Highest Quintile (%): | 14.9 |
| High (%): | 13.9 |
| Medium (%): | 14.2 |
| Low (%): | 17.7 |
| Lowest Quintile (%): | 13.4 |
| Merged/ Closed (%): | 25.9 |
| Total (%): | 100.0 |
| # of Funds: | 1,085 |
| Excess Return Ranking (5 Years Ended 12/31/09): | Low (4) |
Quintile ranking in subsequent non-overlapping 5-year period ended12/31/2014 (percentage of funds)
| Highest Quintile (%): | 13.8 |
| High (%): | 15.1 |
| Medium (%): | 11.0 |
| Low (%): | 12.3 |
| Lowest Quintile (%): | 10.0 |
| Merged/ Closed (%): | 37.9 |
| Total (%): | 100.0 |
| # of Funds: | 1,032 |
| Excess Return Ranking (5 Years Ended 12/31/09): | Lowest Quintile (5) |
Quintile ranking in subsequent non-overlapping 5-year period ended12/31/2014 (percentage of funds)
| Highest Quintile (%): | 13.8 |
| High (%): | 11.5 |
| Medium (%): | 10.9 |
| Low (%): | 10.6 |
| Lowest Quintile (%): | 8.7 |
| Merged/ Closed (%): | 44.6 |
| Total (%): | 100.0 |
Notes: Year zero represents the initial overall ratings of funds. Other points on chart are their average star ratings for the following three, five or ten years. Funds rated by Morningstar can have upto four ratings: a three-year rating, a five-year rating, a 10 year rating, and an overall rating that is based on a combination of the others.
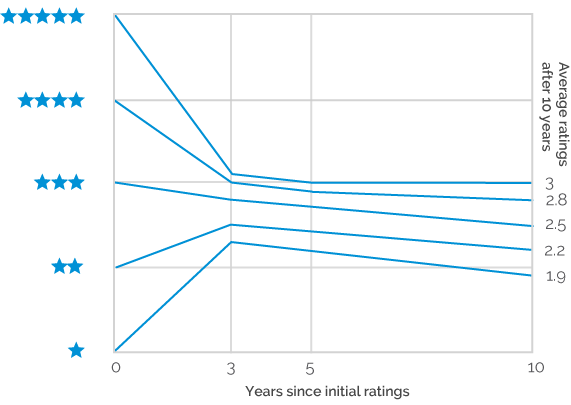
Source: By Kirsten Grind, Tom McGinty and Sarah Krouse, Wall Street Journal October 25, 2017
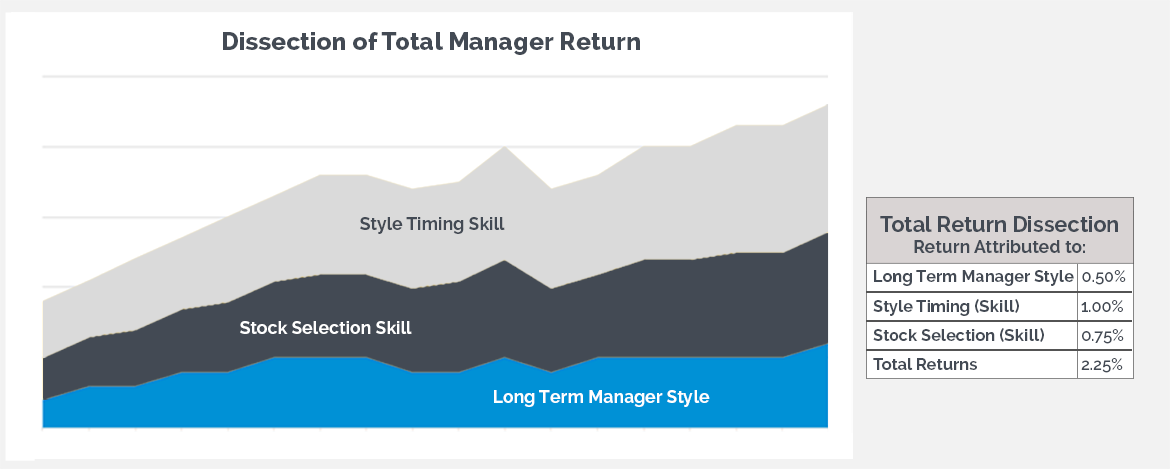
Aapryl’s Perspective on a
Typical Manager’s Investment Process