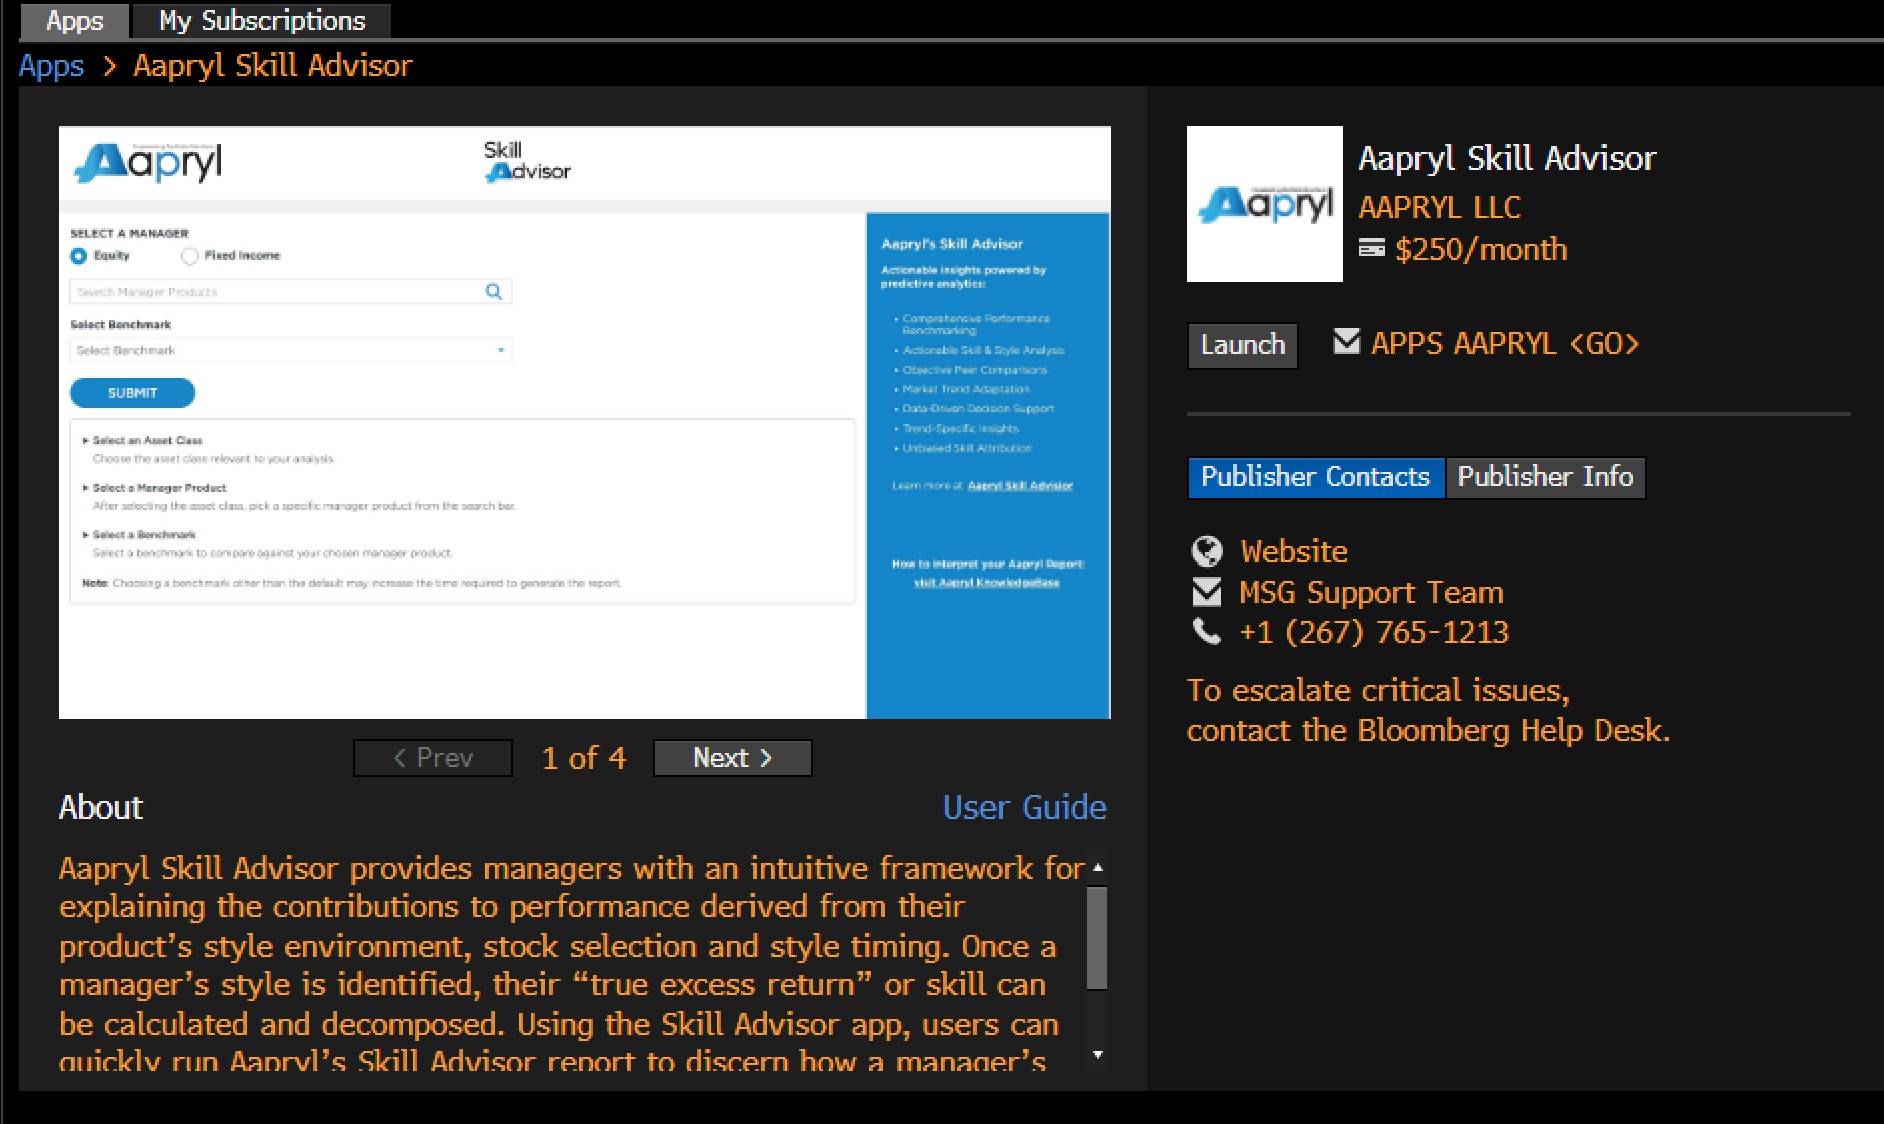
Aapryl’s Skill Advisor Bloomberg App gives investment managers precise insights into their performance by focusing on active decisions rather than style returns. It uses advanced style clustering to compare managers with relevant peers for more accurate assessments.
From your Bloomberg application, investment managers can access detailed analytics that go beyond traditional metrics. Aapryl’s Skill Advisor distinguishes skilled managers from those benefiting from market conditions, helping visualize and compare manager performance across various metrics, styles, and periods, streamlining the selection process.

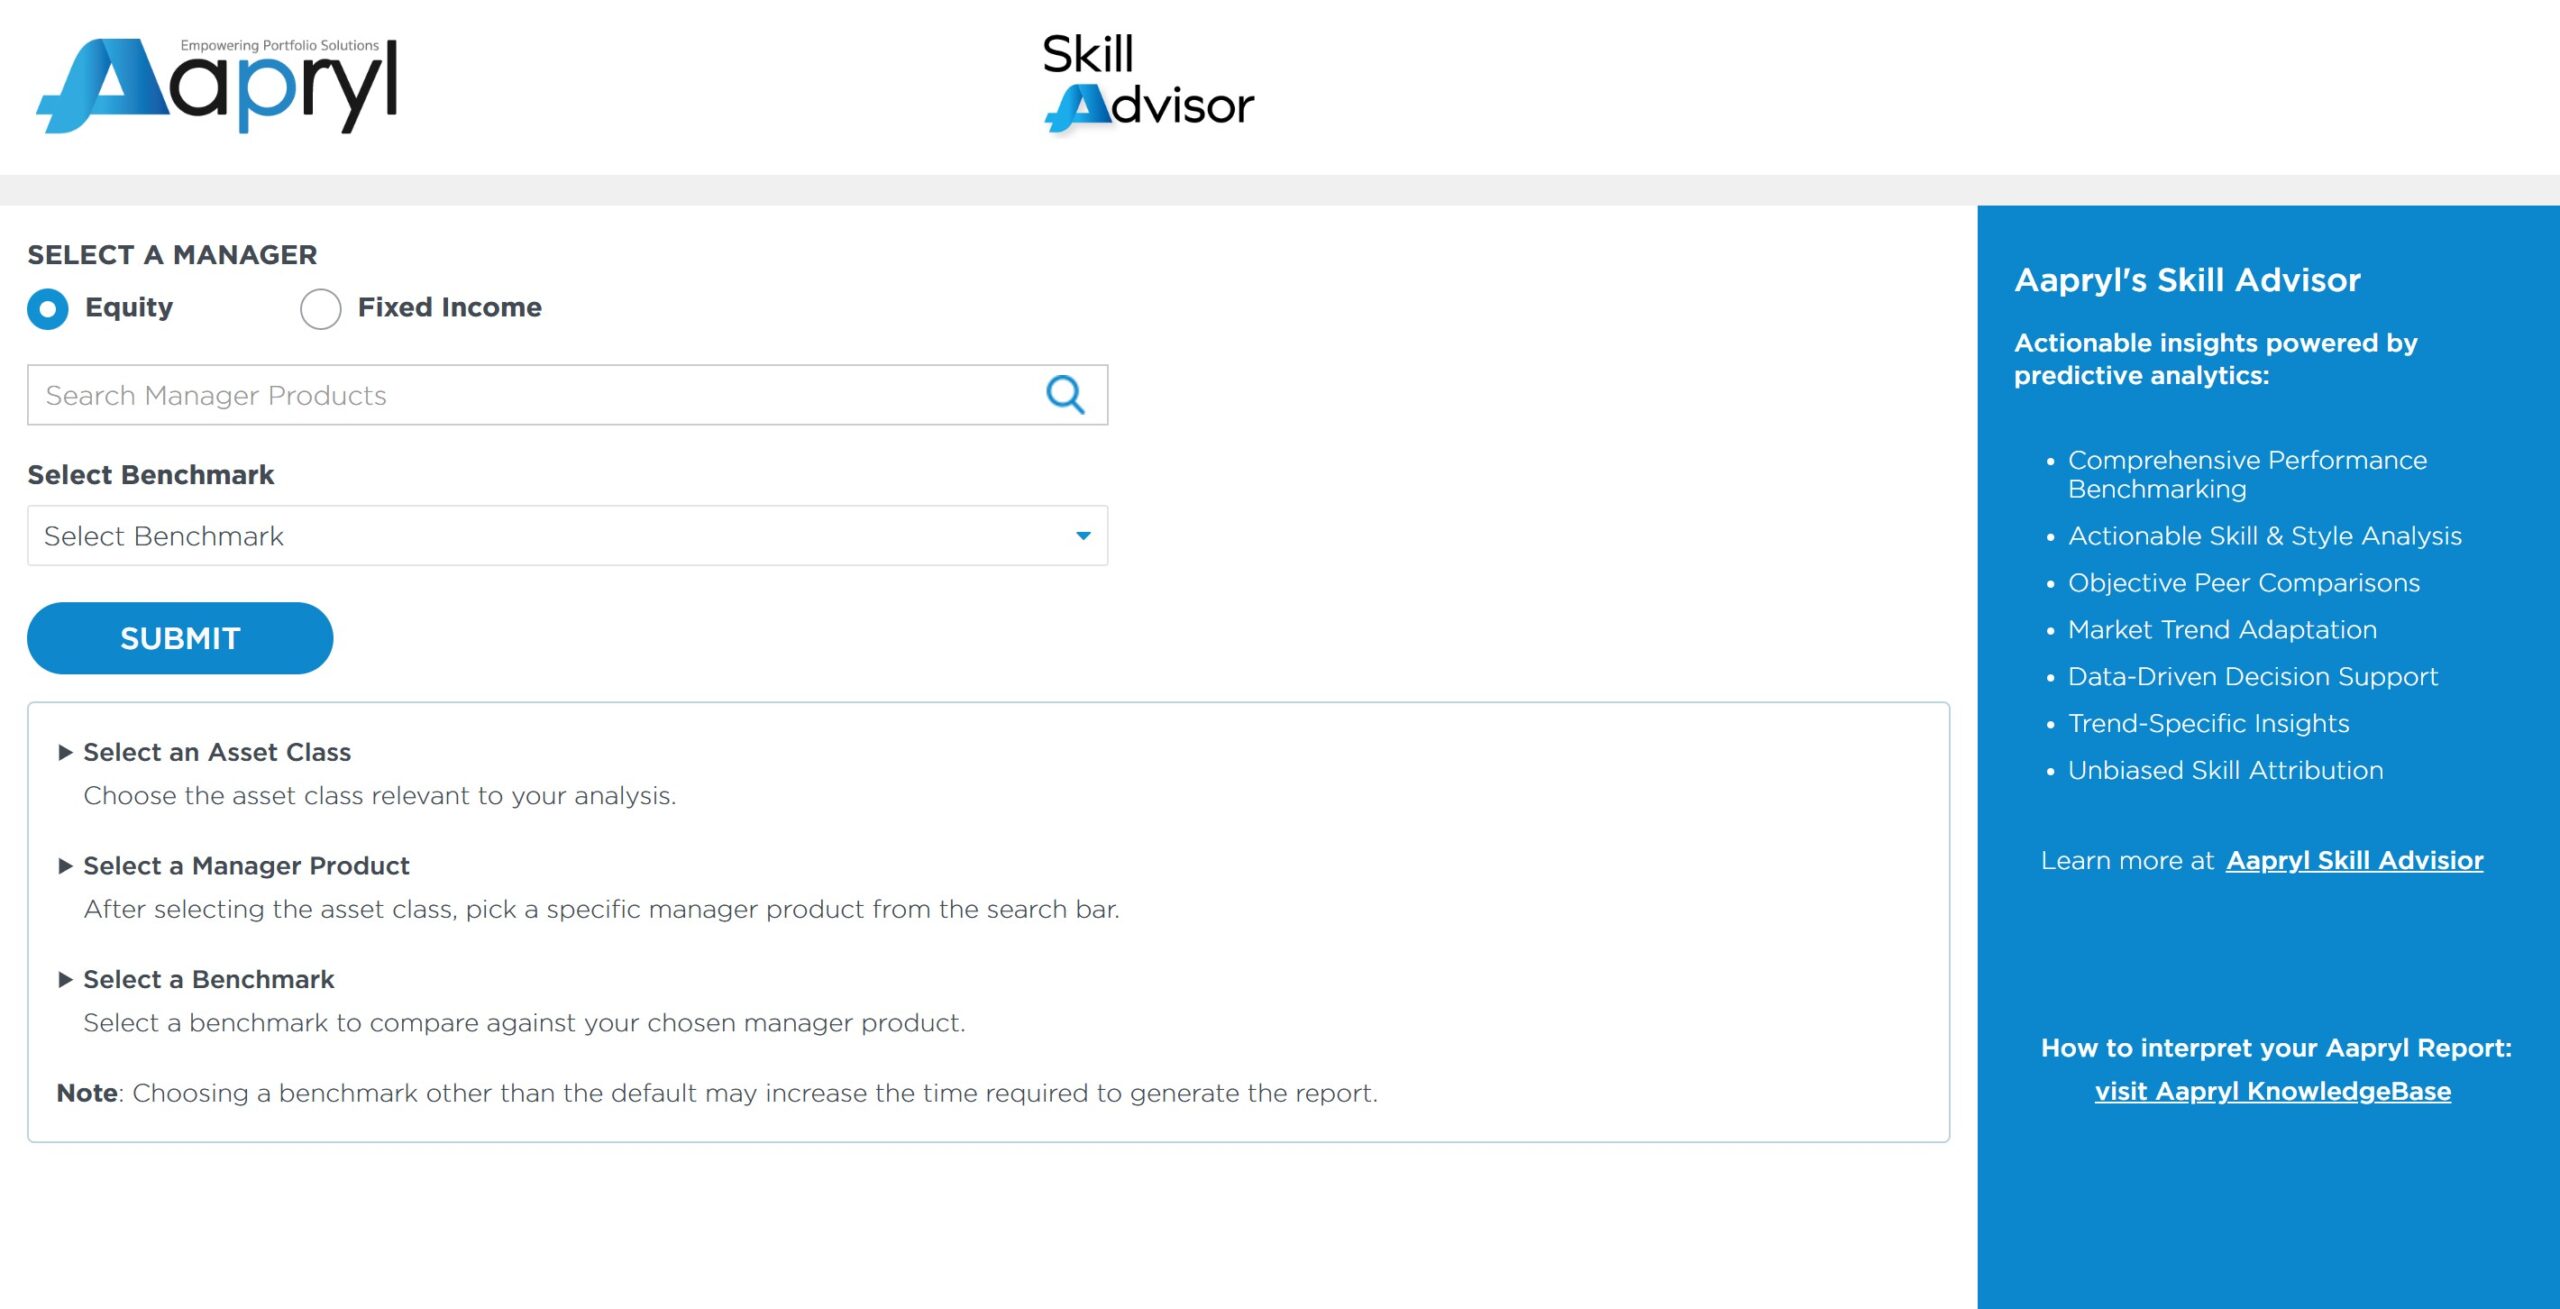
Aapryl’s Skill Advisor provides investment managers with precise performance insights by focusing on active decisions, not just style returns. It uses advanced style clustering to compare managers with relevant peers for more accurate assessments.
Standard benchmarks often fall short in providing specific insights for asset managers. Aapryl’s unique methodology:
The Aapryl Skill Advisor report offers an intuitive framework for explaining performance contributions, considering:
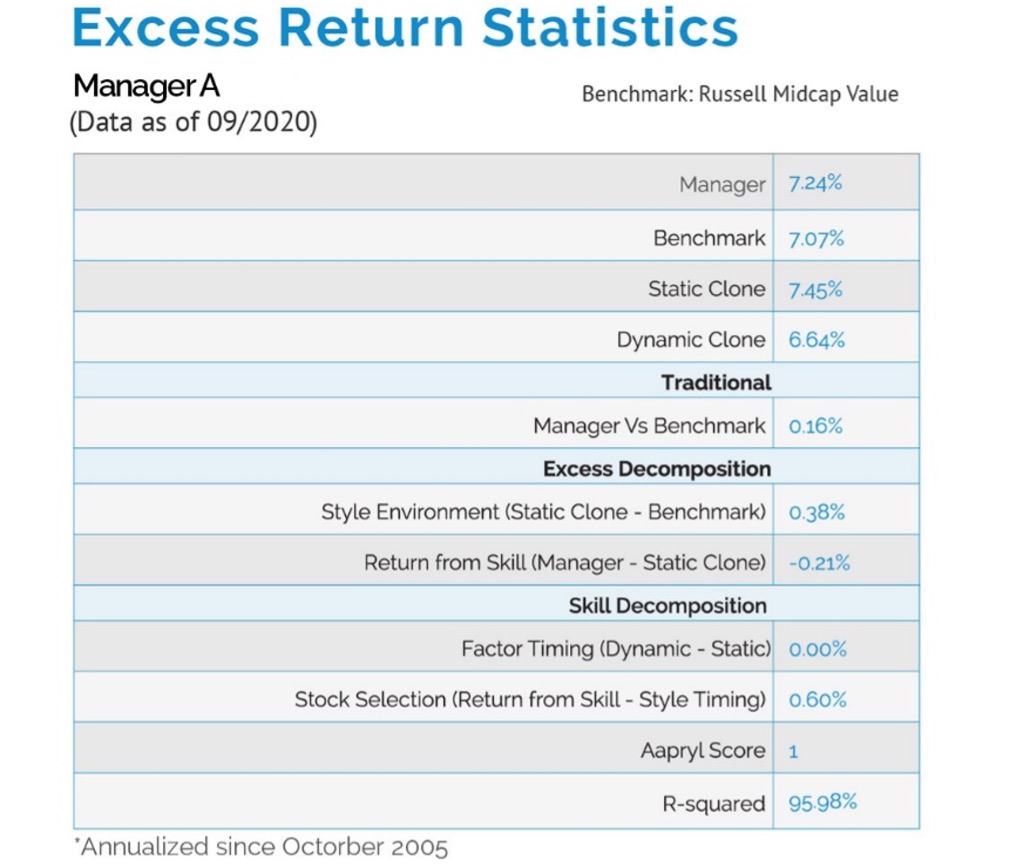
Once a manager’s style is identified, their “true excess return” or skill can be calculated and decomposed. Aapryl breaks down the traditional alpha further by stripping the style return away from its traditional Alpha, focusing on returns directly attributed to the manager’s active decisions and hence its true Alpha.
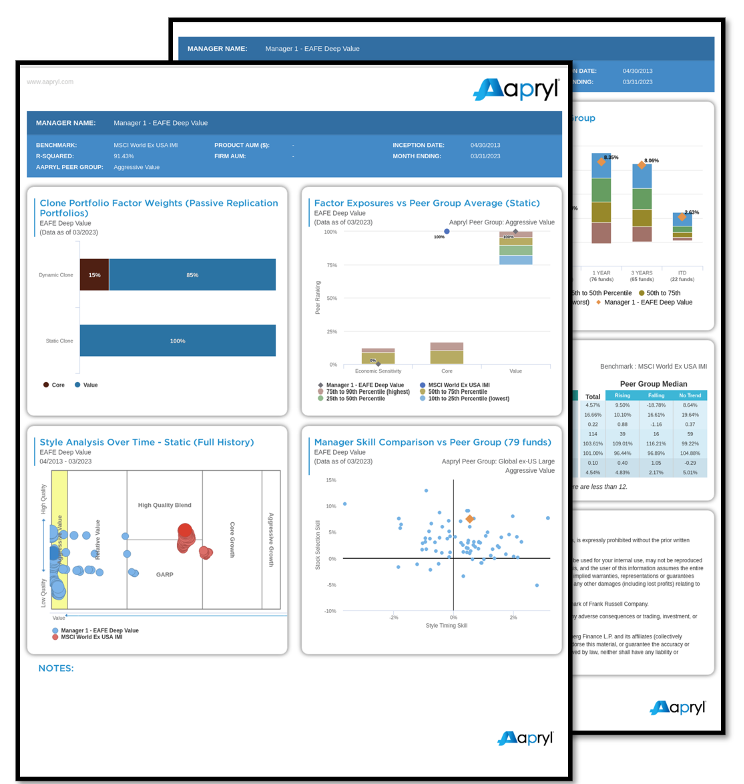
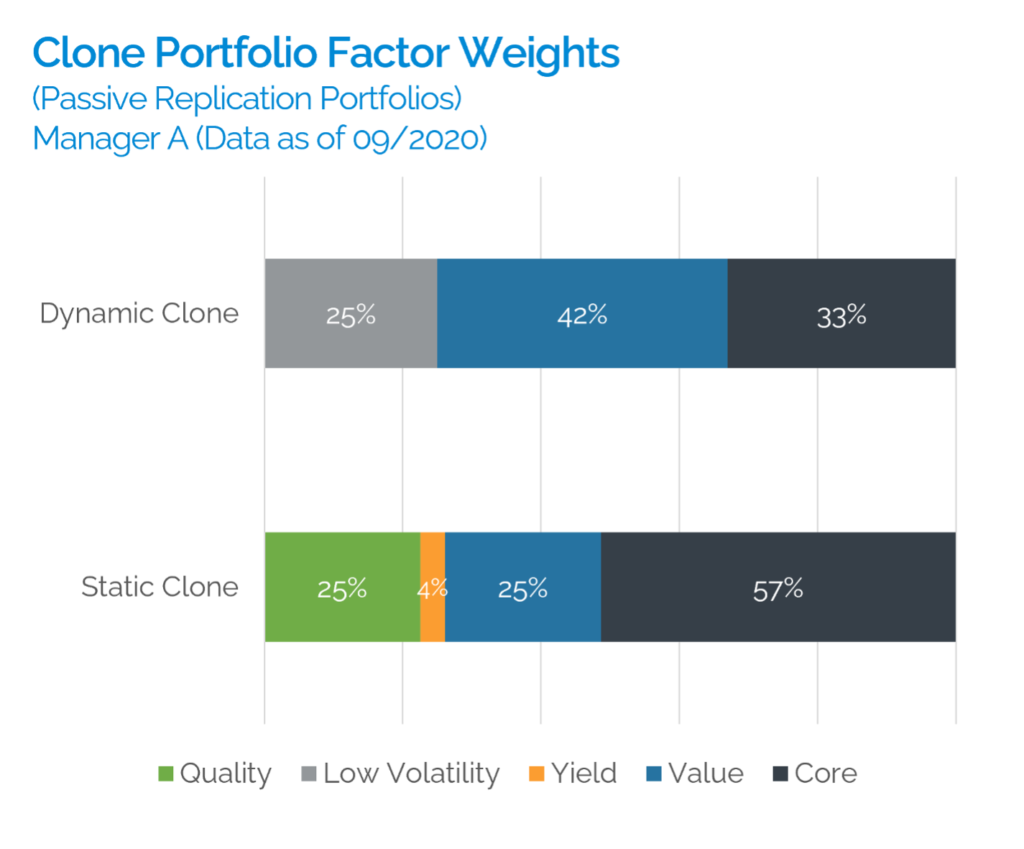
A detailed breakdown of the manager’s performance across key metrics, offering insights into how returns were generated and the role of skill in performance. It clearly displays how much of a managers excess return versus the benchmark is due to the Style environment, and how much was due to the active decisions of the manager. It compares the manager’s return against the benchmark, static clone, and dynamic clone. Includes:
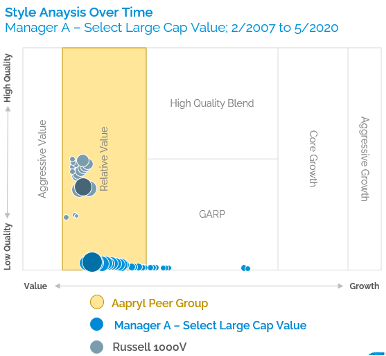
Style Timing: Return from shifts in investment style over time.
Stock Selection: Return from security selection decisions.
Aapryl Score: A proprietary metric evaluating manager performance, rating a managers likelihood to outperform their Peer Group on a 1-5 scale (1 being the most likely).
R-Squared: Measures how well the regression model explains the variation in returns.